Reference
Console Page Tour
On this page
The web console is a single-page application bundled with the server binary. This page lists all pages by their group in the left menu. The Chinese source uses the Chinese interface labels for page names; this translation uses the English UI labels. Paths are the paths in the browser address bar (frontend routes), and descriptions of content within a page cover tabs and panels at the same path. Routes are defined in ui/src/App.tsx, the menu in ui/src/navigation.tsx, and the Chinese labels are in ui/src/i18n/locales/zh/.
Screenshots show the English UI.
Conventions:
- “Page name” uses the menu item label. A page title that differs from the menu label is noted separately.
- Detail pages have no menu item and are accessible only from a list. They appear under their parent menu here.
- Path segments containing
:are variables. The*in/inference-templates/*is a model ID containing a slash, such asorg/model. - Menu highlighting uses only the first path segment, so
/monitor/d/3still highlights “Monitor Center”.
Global Shell
By default, the top bar title combines the product name with “Cluster Management Platform”; the screenshots show “GPUWorks Cluster Management Platform”. You can customize it under Settings → General → Branding. “Overview” sits at the top of the left menu, above five groups: “Monitoring & Analytics”, “Compute”, “Models”, “Inference”, and “Administration”.
Monitoring and analytics come first, then the compute and models that inference depends on, then inference, with administration last. New features are added at the end of their group, so existing entries keep their place. “Collapse menu” at the bottom folds the menu into an icon bar; the choice is saved in the browser.
| Entry | Location | Purpose |
|---|---|---|
| Sign in to the console | Every path displays the sign-in page when you are not signed in; visiting /login after signing in redirects to /dashboard | Sign in with an administrator account. If you forget your password, see reset-password in Install and Upgrade the Control Plane |
| Switch language | Right side of the top bar | Switch the interface language |
| Sign out | Icon on the right side of the top bar | End the current session |
| Page not found | Any undefined path | Displays “No resource matches the address you visited.” |
/ | Root path | Redirects to /dashboard |
| AI Assistant | No separate path: a persistent right sidebar opens through “AI Assistant” in the top bar or ⌘I / Ctrl+I. AI buttons on models, failed instances, unschedulable deployments, and node details start the corresponding task directly in the sidebar | When empty, lists tasks available on the current page and highlights objects that need attention. Shows platform checks first, then streams AI analysis and suggests follow-up questions after the response. Configure “AI Services” in “Settings” before using AI analysis; see Use the AI Assistant |
Overview
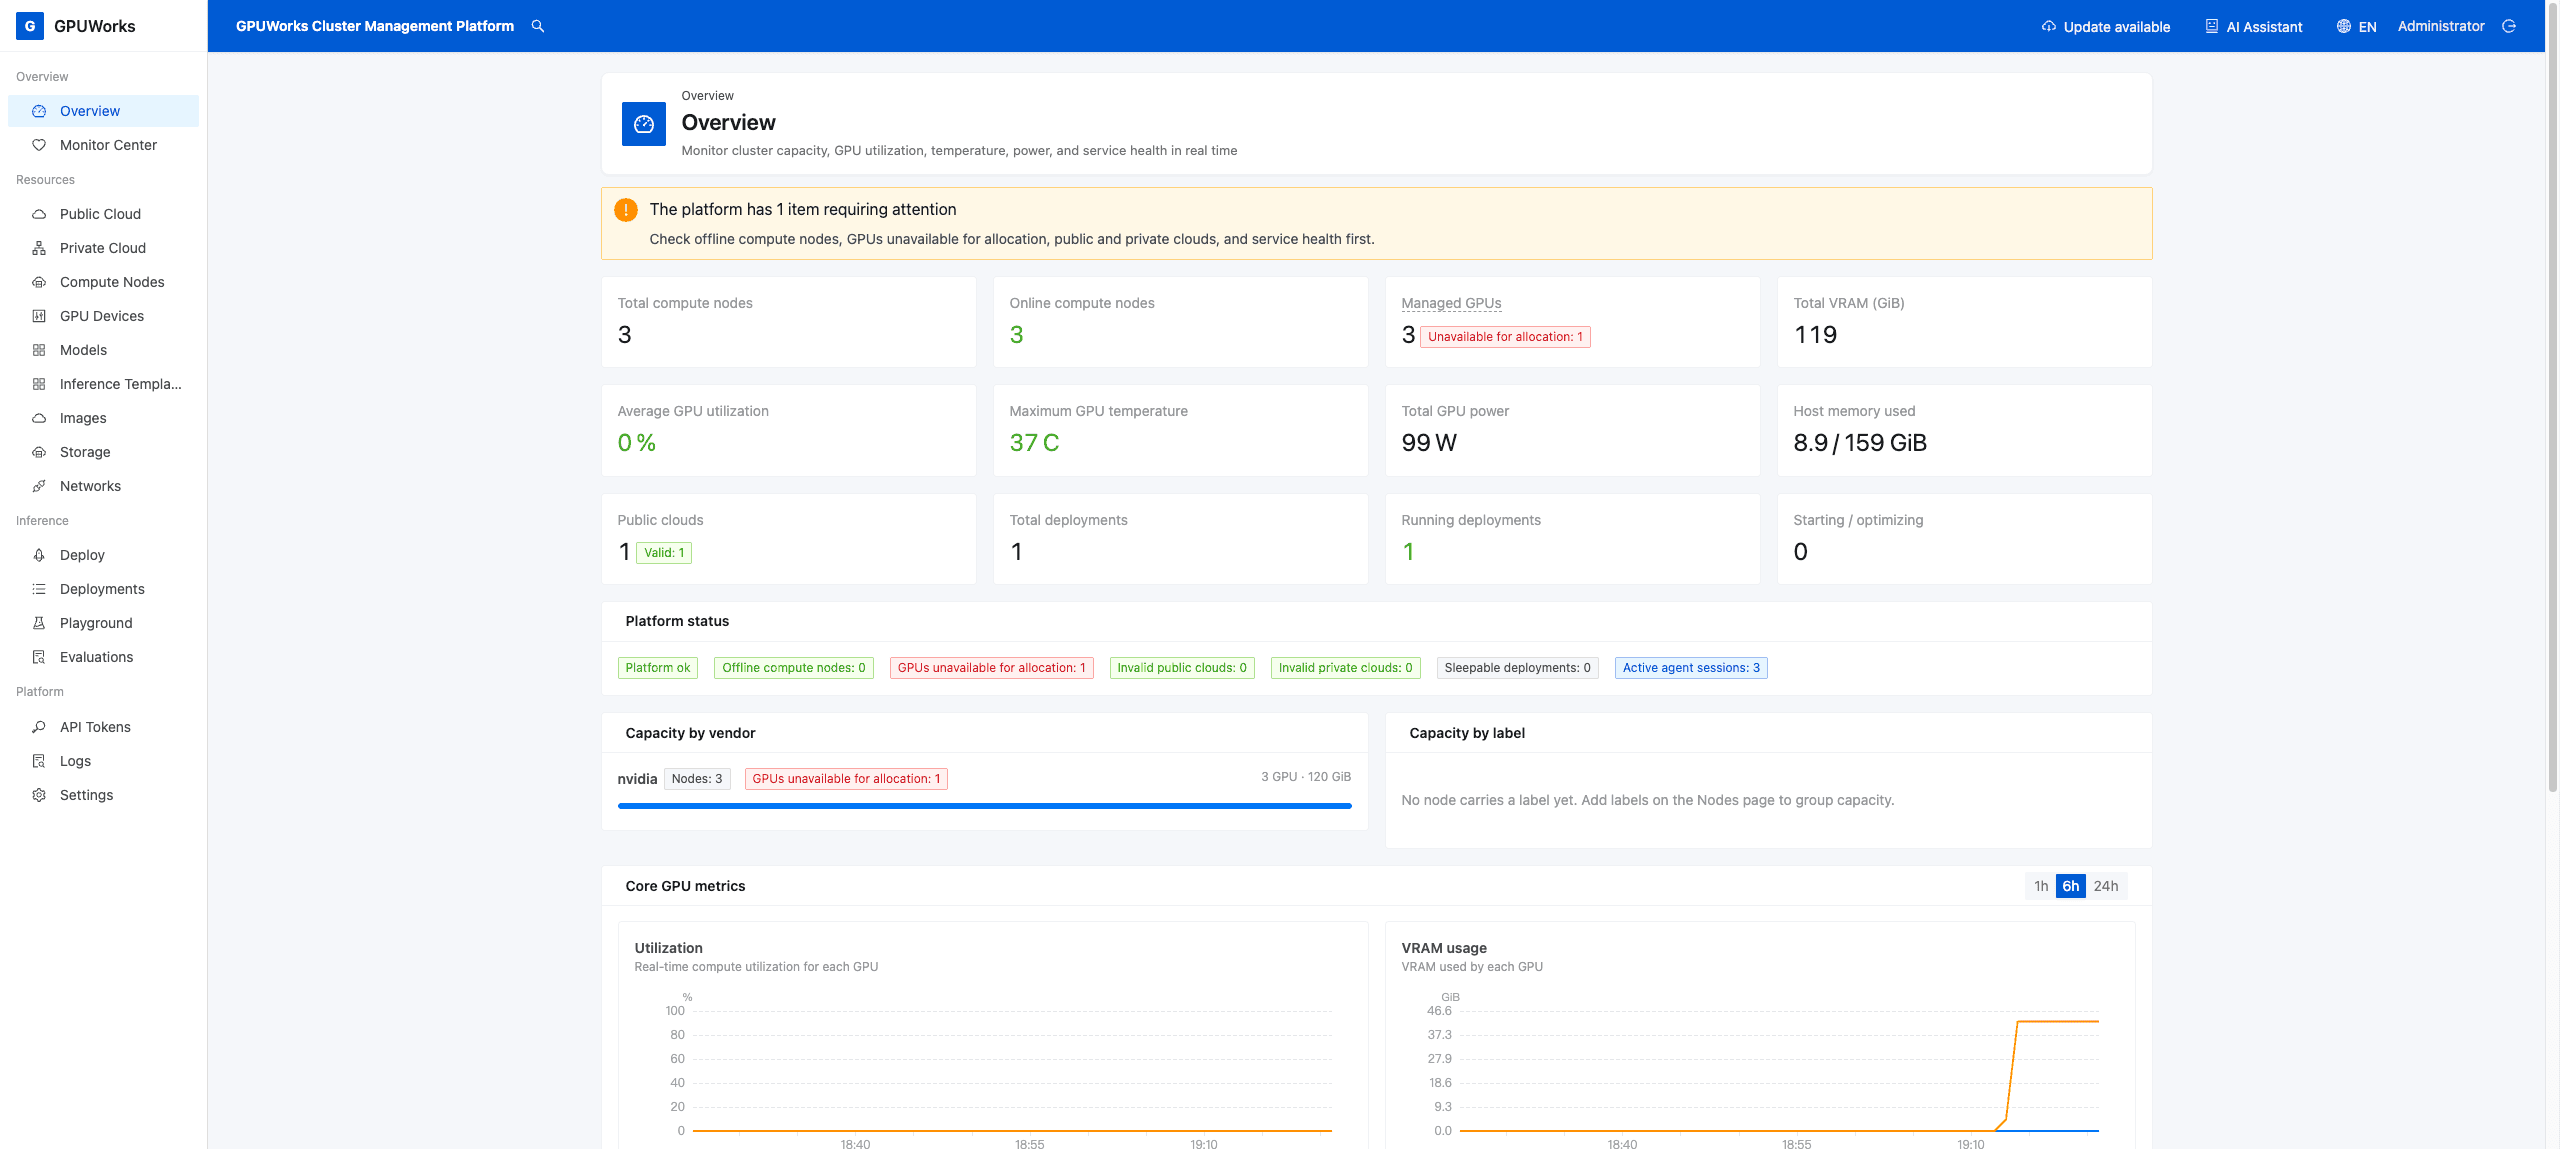
See at a glance whether the cluster is healthy, how busy the GPUs are, and what needs attention.
| Page name | Path | Purpose | Further reading |
|---|---|---|---|
| Overview | /dashboard | Cluster overview: “Platform status” (offline compute nodes, abnormal GPUs, abnormal public/private clouds, active agent sessions, and deployments that can sleep), compute node and deployment statistics cards, “Core GPU metrics” (utilization, temperature, power consumption, and GPU memory usage), and capacity distribution by vendor and label | View Metrics and Search Logs |
Monitoring & Analytics
Live state, GPU occupancy, and long-term usage, in the order you read them when tracking a problem down.
| Page name | Path | Purpose | Further reading |
|---|---|---|---|
| Monitor Center | /monitor | Three levels of operational views: cluster, service, and instance. Includes signal cards at the top, the “Service” table, GPU memory by node, “Cluster token throughput”, and the optional “Metric explorer”. Select a shared time range in the upper right, using a preset or a custom range; a custom range does not refresh automatically. The adjacent search box finds requests across deployments by request ID or trace ID. Click a search result or any row in the request view to see its details | View Metrics and Search Logs |
| Service monitoring (secondary page, titled with the deployment name) | /monitor/d/:id | Monitor a single deployment: primary diagnosis, stages in the request path, the “Requests” view (live / historical), “Request accounting (last 5 min)”, TTFT / TPOT and two request distribution charts, the “Replicas” table, and “Logs”. Open it from the service table in “Monitor Center”; “Go to deployment” opens the corresponding deployment | View Metrics and Search Logs, PD Disaggregation Deployment |
| Scheduling analysis | /scheduling | See who holds each card and what scheduling did: the GPU heatmap (one cell per card, hover for its occupants), deployments waiting for placement and waiting wakes, upcoming schedules in the next 24 hours, residency and switching statistics of deployments sharing cards, and the scheduling history (filter by category, deployment, and time; the deployment names and the yield targets in the history are clickable and open the deployment details) | Use Scheduling Analysis |
| Usage analytics | /analytics/:tab | Long-term statistics: “Token usage” (by API key, deployment, or model), “Service quality”, “GPU utilization” (switch the heatmap between utilization, power, temperature, and GPU memory), and “GPU hours”. View any time range by hour or by day, and export to CSV | View Usage Analytics |
Compute
Where the compute comes from: connected public and private cloud platforms, and the compute nodes and GPUs, storage, and networks they and your own machines provide.
| Page name | Path | Purpose | Further reading |
|---|---|---|---|
| External Platforms | /providers | Everything that hands machines over to gpuworks, in one list: public cloud accounts, ZStack Cloud private cloud environments, and Kubernetes clusters (connected without a cloud account: you run kubectl apply yourself, as for a self-managed k3s). Clicking a card under “Quick Connect” adds that platform. The card names the resources the platform connects: by the vendor's product name where it has one (“ECS” and “ACK” for Alibaba Cloud), otherwise by the kind of resource (VM, Container, Host, Kubernetes); the small mark beside the name opens the vendor's site; administrators get one more card, “Kubernetes cluster”. Every source is added in the “Add External Platform” dialog: under “External platform” tabs choose Public cloud, Private cloud, or Kubernetes cluster, then a list chooses the vendor, and once one is chosen the dialog lists what it connects and how each resource becomes compute nodes. A cloud vendor takes a name and credentials; a Kubernetes cluster takes a name, the management node address, and a node selector (there is no vendor field: the agent on each node detects its accelerator; “Advanced” also holds the namespace, agent image registry and image, RuntimeClass, containerd socket, engine port range, idle return, priority, and allow preemption), and after connecting the dialog gives the kubectl apply command to run in the cluster. In the list, the “Vendor” column shows Alibaba Cloud, RunPod, and so on, and “—” for a Kubernetes cluster connected on its own; “Platform type” shows Public cloud, Private cloud, or Kubernetes; “Connects” is the kinds of resource it can hand over; “Nodes joined” is how many machines joined through the row and are compute nodes now, and the number opens “Compute Nodes” on those nodes (both headers explain themselves on hover); “Updated” is hidden by default. When the filters leave nothing, the list says “No external platform matches the filters” and offers “Clear filters”. The list's toolbar starts with “Sync All” (it syncs the instances of every cloud account that can be synced) and “Last synced: ” (the latest sync of any account). A cloud account's row has “Edit”, “Sync”, and “Delete” icon buttons in its actions column. Before deleting, the confirmation states the consequences: its instances and clusters are no longer synced, the instances and clusters in the cloud are not released, and the compute nodes that joined stay; the cluster entries connected from it become clusters connected on their own, whose nodes keep working, but the platform can no longer apply to or uninstall from those clusters. Expanding a cloud account starts with a line holding “Sync” (the same as the row's own “Sync”: it lists the instances from the vendor again, and the managed clusters are read again after it) and “Last synced: ” (“Instances not synced yet” for an account never synced); a vendor that cannot list its instances has neither this “Sync” nor a sync time. The instance table follows. For a vendor with managed Kubernetes (Alibaba Cloud, DigitalOcean) the table is grouped by what the machines belong to, and each group can be collapsed. First comes the “Standalone instances” group: its header carries the product tag (such as “ECS”) and the number of instances, plus the number of nodes joined once an instance has joined, and its rows list the account's own instances (name and instance ID, GPU, status, price, region, connection, actions); the machines of a cluster's node pools are not among them. Then comes one group per managed cluster: the header shows the cluster name, the cluster type (“ACK managed”, “ACK dedicated”, “DOKS”), a “Shared namespace” badge where one applies, and the status; a cluster not connected yet also has “Connect” (it opens the cluster drawer, whose “GPU node pools” is the list of the chosen pools: all by default, each removable except the last, a removed one added back from the “Add a node pool” list; pools of different vendors may be chosen together), and a connected one has the administrator's actions (see below). The group shows the cluster's facts as “label value” pairs in two columns: cluster ID, region, version, API server (“Publicly reachable” or “Private network only”), GPU node pools (for a connected cluster only the pools its entry holds, with “Change” under them for an administrator, which opens a drawer to change the pools with the same list, saying that a held pool's nodes will leave when it is taken out; apply again after saving; for a cluster not connected yet, its GPU node pools), and for a connected cluster also nodes joined (the count and the split by vendor, such as “Nodes: 2 · NVIDIA ×2”, which opens “Compute Nodes” on those nodes), namespace, card return, and creation time; the cluster's nodes are not listed one by one here. A cluster the account no longer has, but whose entry remains, is still listed as a group, so it can be revoked or deleted. A vendor without managed Kubernetes (RunPod, ZStack Cloud, and others) has an ungrouped instance table. Expanding a Kubernetes cluster connected on its own shows “label value” pairs in two columns: “Connected by”, node selector, namespace, card return, creation time, and nodes joined (the count and the split by vendor); while no node has joined, the connect command is below them. The administrator's actions on a cluster entry are in the actions column of a cluster connected on its own and in a cloud cluster's group header: the common ones are shown directly (“Edit” and “Apply to the cluster” for a cloud cluster, “Edit” and “Copy connect command” for a cluster connected on its own), and the rest are in the “More” menu, with those that uninstall or delete below a rule. The possible actions are: “Edit”; for a cloud cluster “Apply to the cluster” and “Remove from the cluster”; “Copy connect command” and “View manifest”; “Uninstall” where gpuworks cannot remove it for you (a dialog lists the kubectl commands, in order, that remove the agents from the cluster); “Revoke” and “Delete” (each confirmed in a dialog). A “Shared namespace” badge (beside the name in the row of a cluster connected on its own, in a cloud cluster's group header) warns that another entry may use the same namespace in the same cluster. Deleting a cluster that still has nodes shows in the confirmation how many are left, with a way to “Remove from the cluster” or “Uninstall”. A cluster's status is “Not connected yet” until the first node joins, with “Troubleshoot” beside it once no node has joined for 5 minutes. “Install Agent” on an instance's or physical host's row installs the agent on it. With ?category=<platform type> or ?resource=<resource type> in the address the list opens filtered (the overview's public and private cloud counts link this way), ?open=<row> opens it with that row expanded, and adding &cluster=<cluster entry> scrolls that cluster's group of the account into view (the “Source” of a compute node links this way). The old path /zstack redirects here filtered to private clouds, and /kubernetes redirects here filtered to the platforms that connect Kubernetes | Rent Cloud GPUs, Onboard ZStack Cloud, Connect a Kubernetes Cluster, API: Kubernetes (Cluster Connection) |
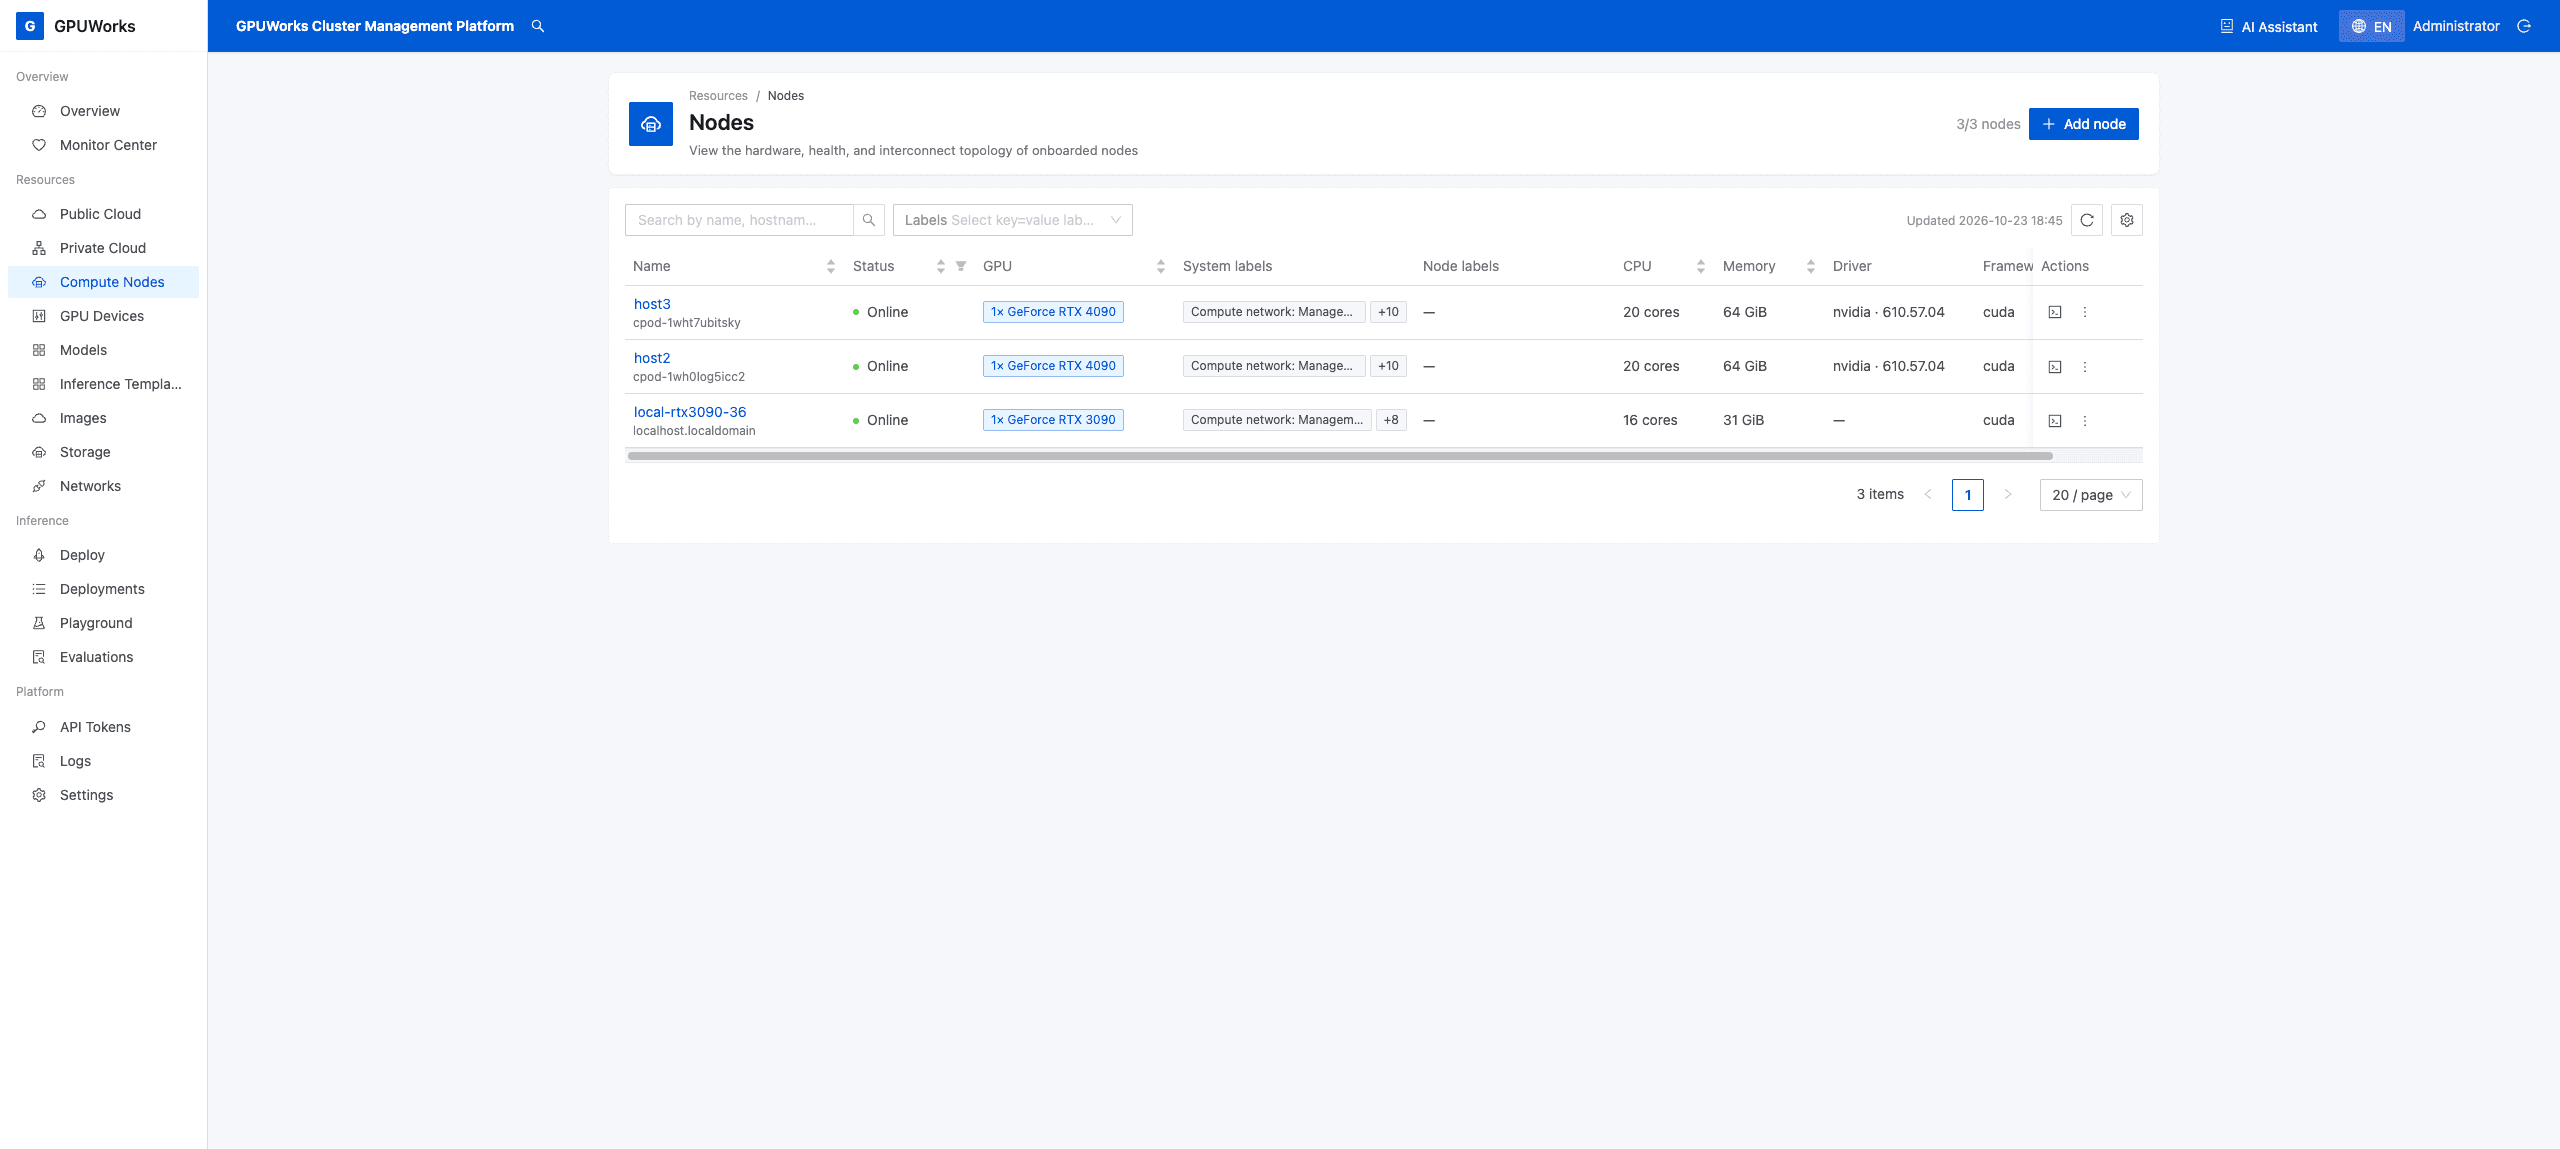
| Compute Nodes (page title “Nodes”) | /nodes | Node list and detail drawer: the “Source” column says which external platform a node joined through (an instance of a cloud account, or a node of a Kubernetes cluster) and opens that platform's row under “External Platforms” (for a node of a cloud account's cluster, the account is expanded and that cluster's group scrolled into view), while a node added by hand says “Added by hand”, and one whose source the server could not read says “Source could not be read”; its header filters by source (a cloud account, a cluster, or added by hand; several may be ticked), and the filter is kept in the address as ?source=; nodes from Kubernetes also carry the system labels “Kubernetes cluster” and “Kubernetes node”, and nodes cordoned by Kubernetes show as stopped by the platform, with the reason, in their scheduling status; on an NVIDIA Kubernetes node whose instances can see every GPU device of the node and are held to their own card by CUDA_VISIBLE_DEVICES alone, the status row of the drawer's “Overview” tab carries the “GPU devices are soft-isolated” tag, with the reason and copyable commands to restore strict isolation below it (not shown while the node is offline; see Connect a Kubernetes Cluster); “Add node” (curl installation command or SSH wizard), view hardware/GPU/health, read-only “System labels” generated dynamically by the platform from vendor, model, architecture, and networks for each role, and “Agent” version (including the “Upgrade available” badge and “Upgrade Agent”); edit names and node labels, “Diagnose”, “Terminal”, and delete. The drawer also includes “Out-of-band SSH channel”, “Out-of-band recovery”, and “Pull proxy” (read-only, showing the proxy this node uses and dockerd status; Docker nodes offer “Restart dockerd”), plus “Latest rejection” when the node has a handshake rejection record | Connect, Upgrade, and Uninstall Nodes, Upgrades and Version Compatibility, Configure Node Networks |
| Terminal (secondary page, titled “Terminal · node name”) | /nodes/:uuid/terminal | Full-screen terminal in a new tab without the menu shell. Opens the node host shell by default; ?target=container&ref=<container-id> opens an instance container. Access it through “Terminal” in “Compute Nodes” or the instance panel in “Inference Services”. Disable it under “Web Terminal” in “Settings” | Security Model and Trust Boundaries, Complete REST API Routes |
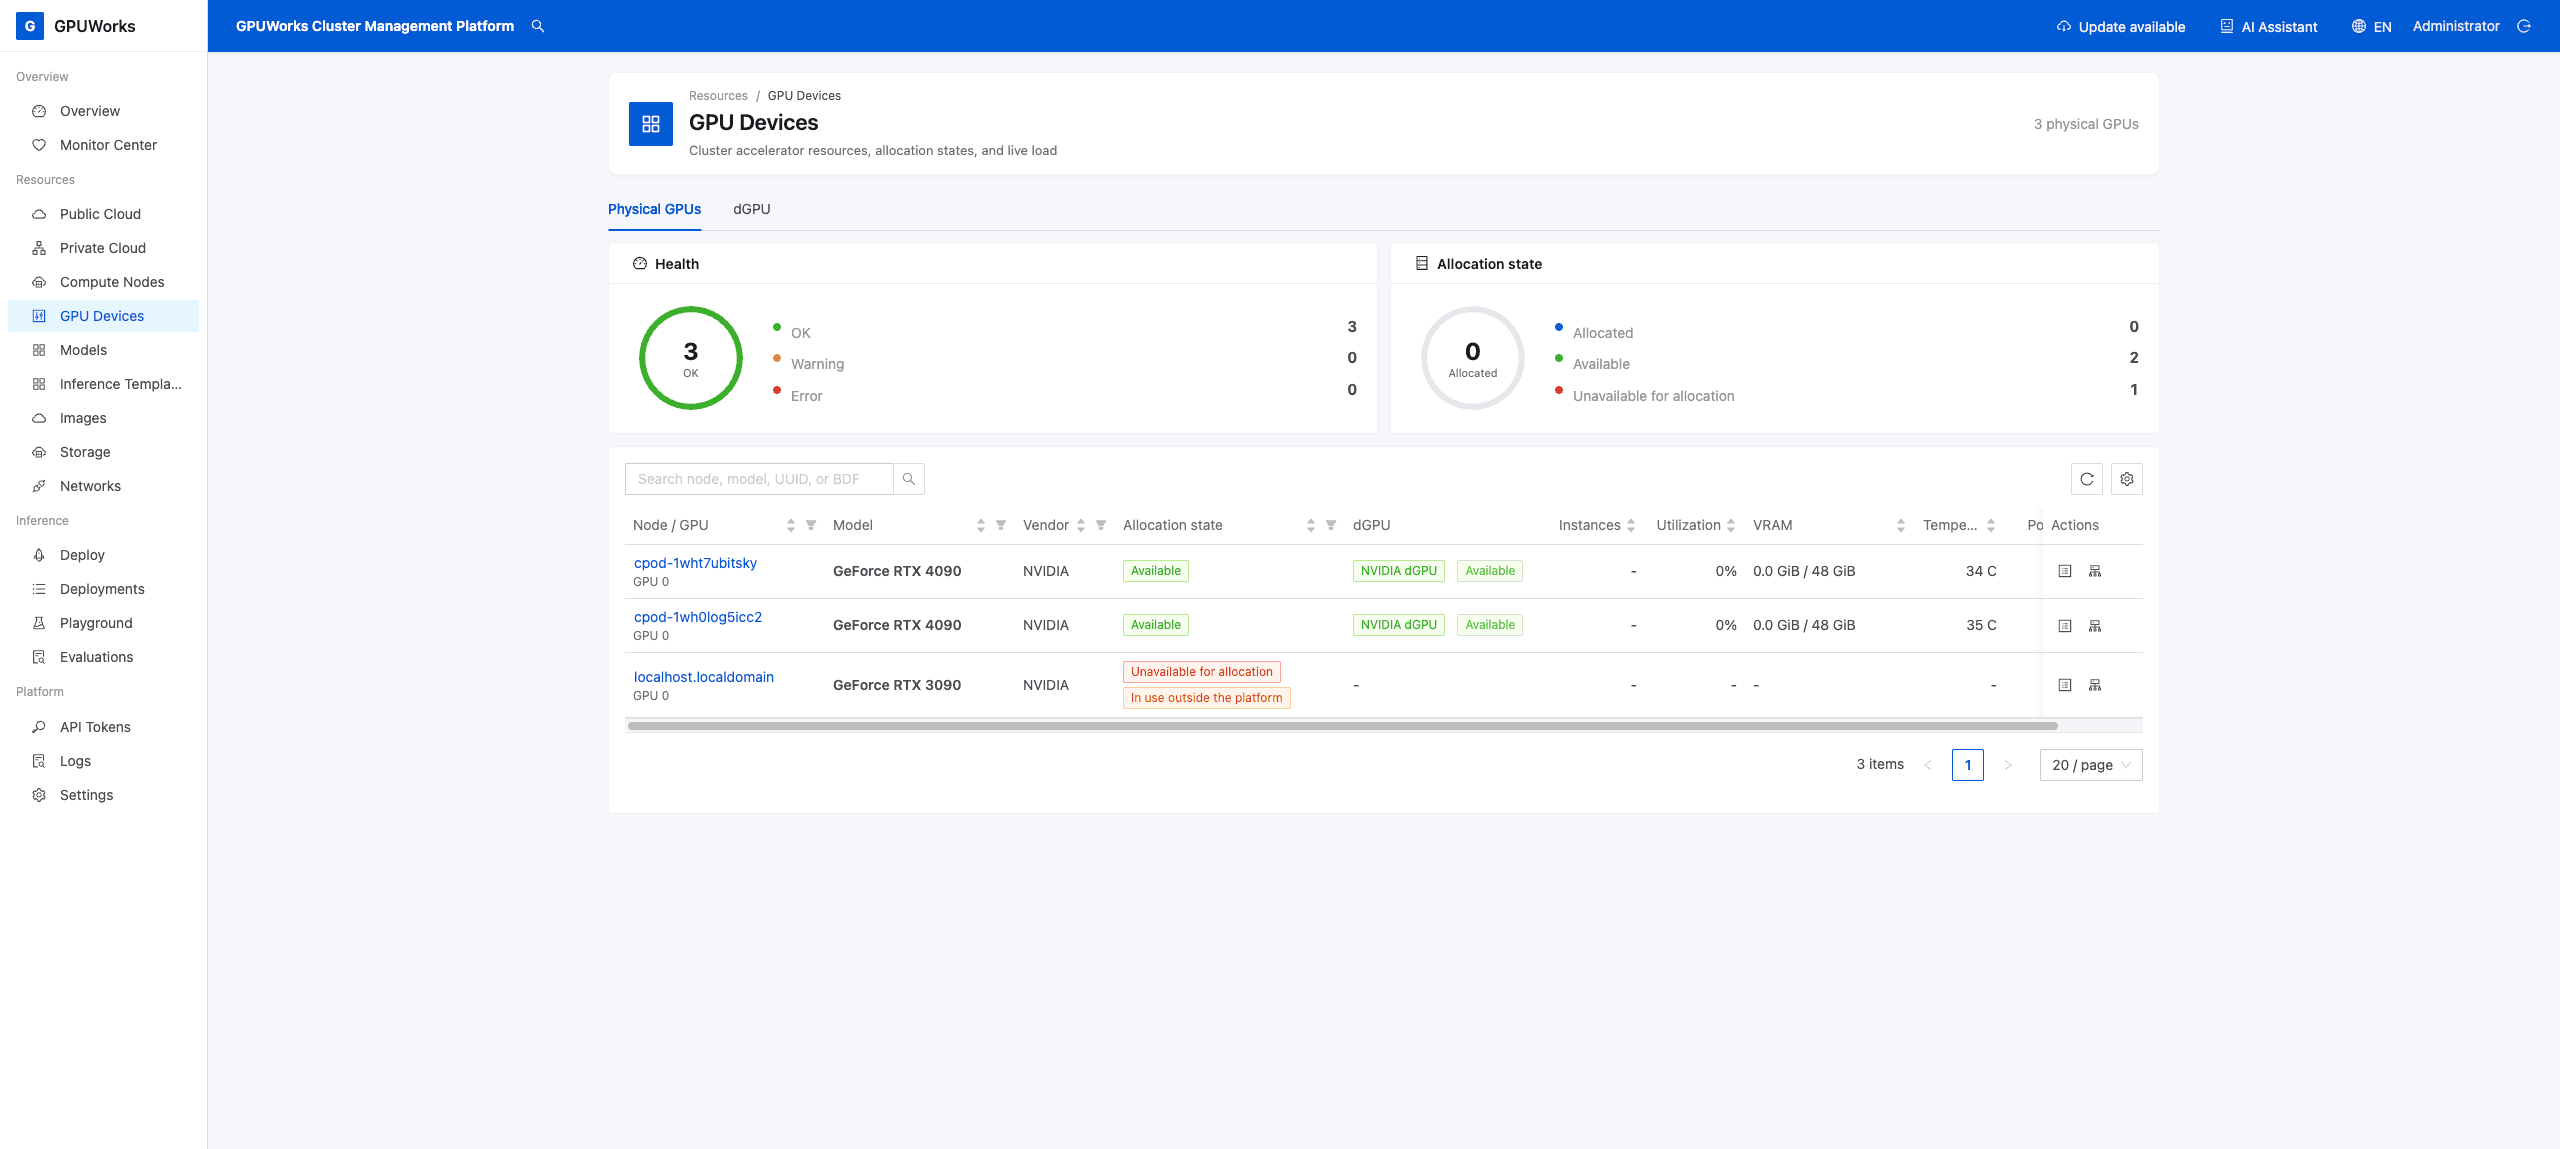
| GPU Devices | /gpus | Cluster accelerator resources, allocation status, and live load, filterable by node, vendor, model, and allocation status. Allocation status represents the card's current allocation workload: “Unknown” when its node is disconnected, “Unavailable for allocation” when it accepts no allocations, and otherwise classified by occupancy; the adjacent health badge explains why a card cannot be used. Two tabs: “Physical GPUs” (the “dGPU” column shows the number of slices created on a card and their combined limits; “Memory allocation” in the details uses scheduler accounting to chart each slice, overhead beyond limits, sleeping residue, and remaining memory, with actual whole-card usage marked) and “dGPU” (each slice holding a memory quota and its deployment/instance, including starting and sleeping instances; actual memory uses HAMi statistics and excludes approximately 0.4 GiB of CUDA context; the SM reference is sampled, and detail charts use 1-minute averages; inline “Change quota” changes the parent deployment's memory limit and applies it to running instances on save, but engines that allocate memory at startup require an instance restart on the deployment page to use it; slices that cannot apply it immediately show “X GiB after restart”) | Enable and Troubleshoot dGPU, GPU, Detection, Deployment, and dGPU Support Matrix |
| Storage | /storage | Add and manage storage (local storage, NFS, NFS with a local cache, and already mounted shared directories): test mounts, node scope and coverage, default and disabled (read-only) settings, per-node mount status, other GPUWorks control planes using the storage, scanning and importing an existing model library, and node cache cleanup. Node disk usage levels and managed usage appear below | Use Storage |
| Networks | /networks | Declare storage sync, compute, and serving networks and apply them to nodes or node labels. The list includes the built-in “Management” network. “Network topology and settings” at the bottom illustrates which network carries each traffic type | Configure Node Networks |
| Network details (secondary page, titled with the network name) | /networks/:id | Three tabs: “Overview” (resolved interfaces/addresses on each node, with edit and delete; the built-in management network is read-only, with roles toggled per node), “Internal test” (TCP tests, plus RDMA bandwidth tests for RDMA networks), and “Monitoring” | Configure Node Networks |
Models
What a deployment picks before it starts: models, inference templates, and runtime images.
| Page name | Path | Purpose | Further reading |
|---|---|---|---|
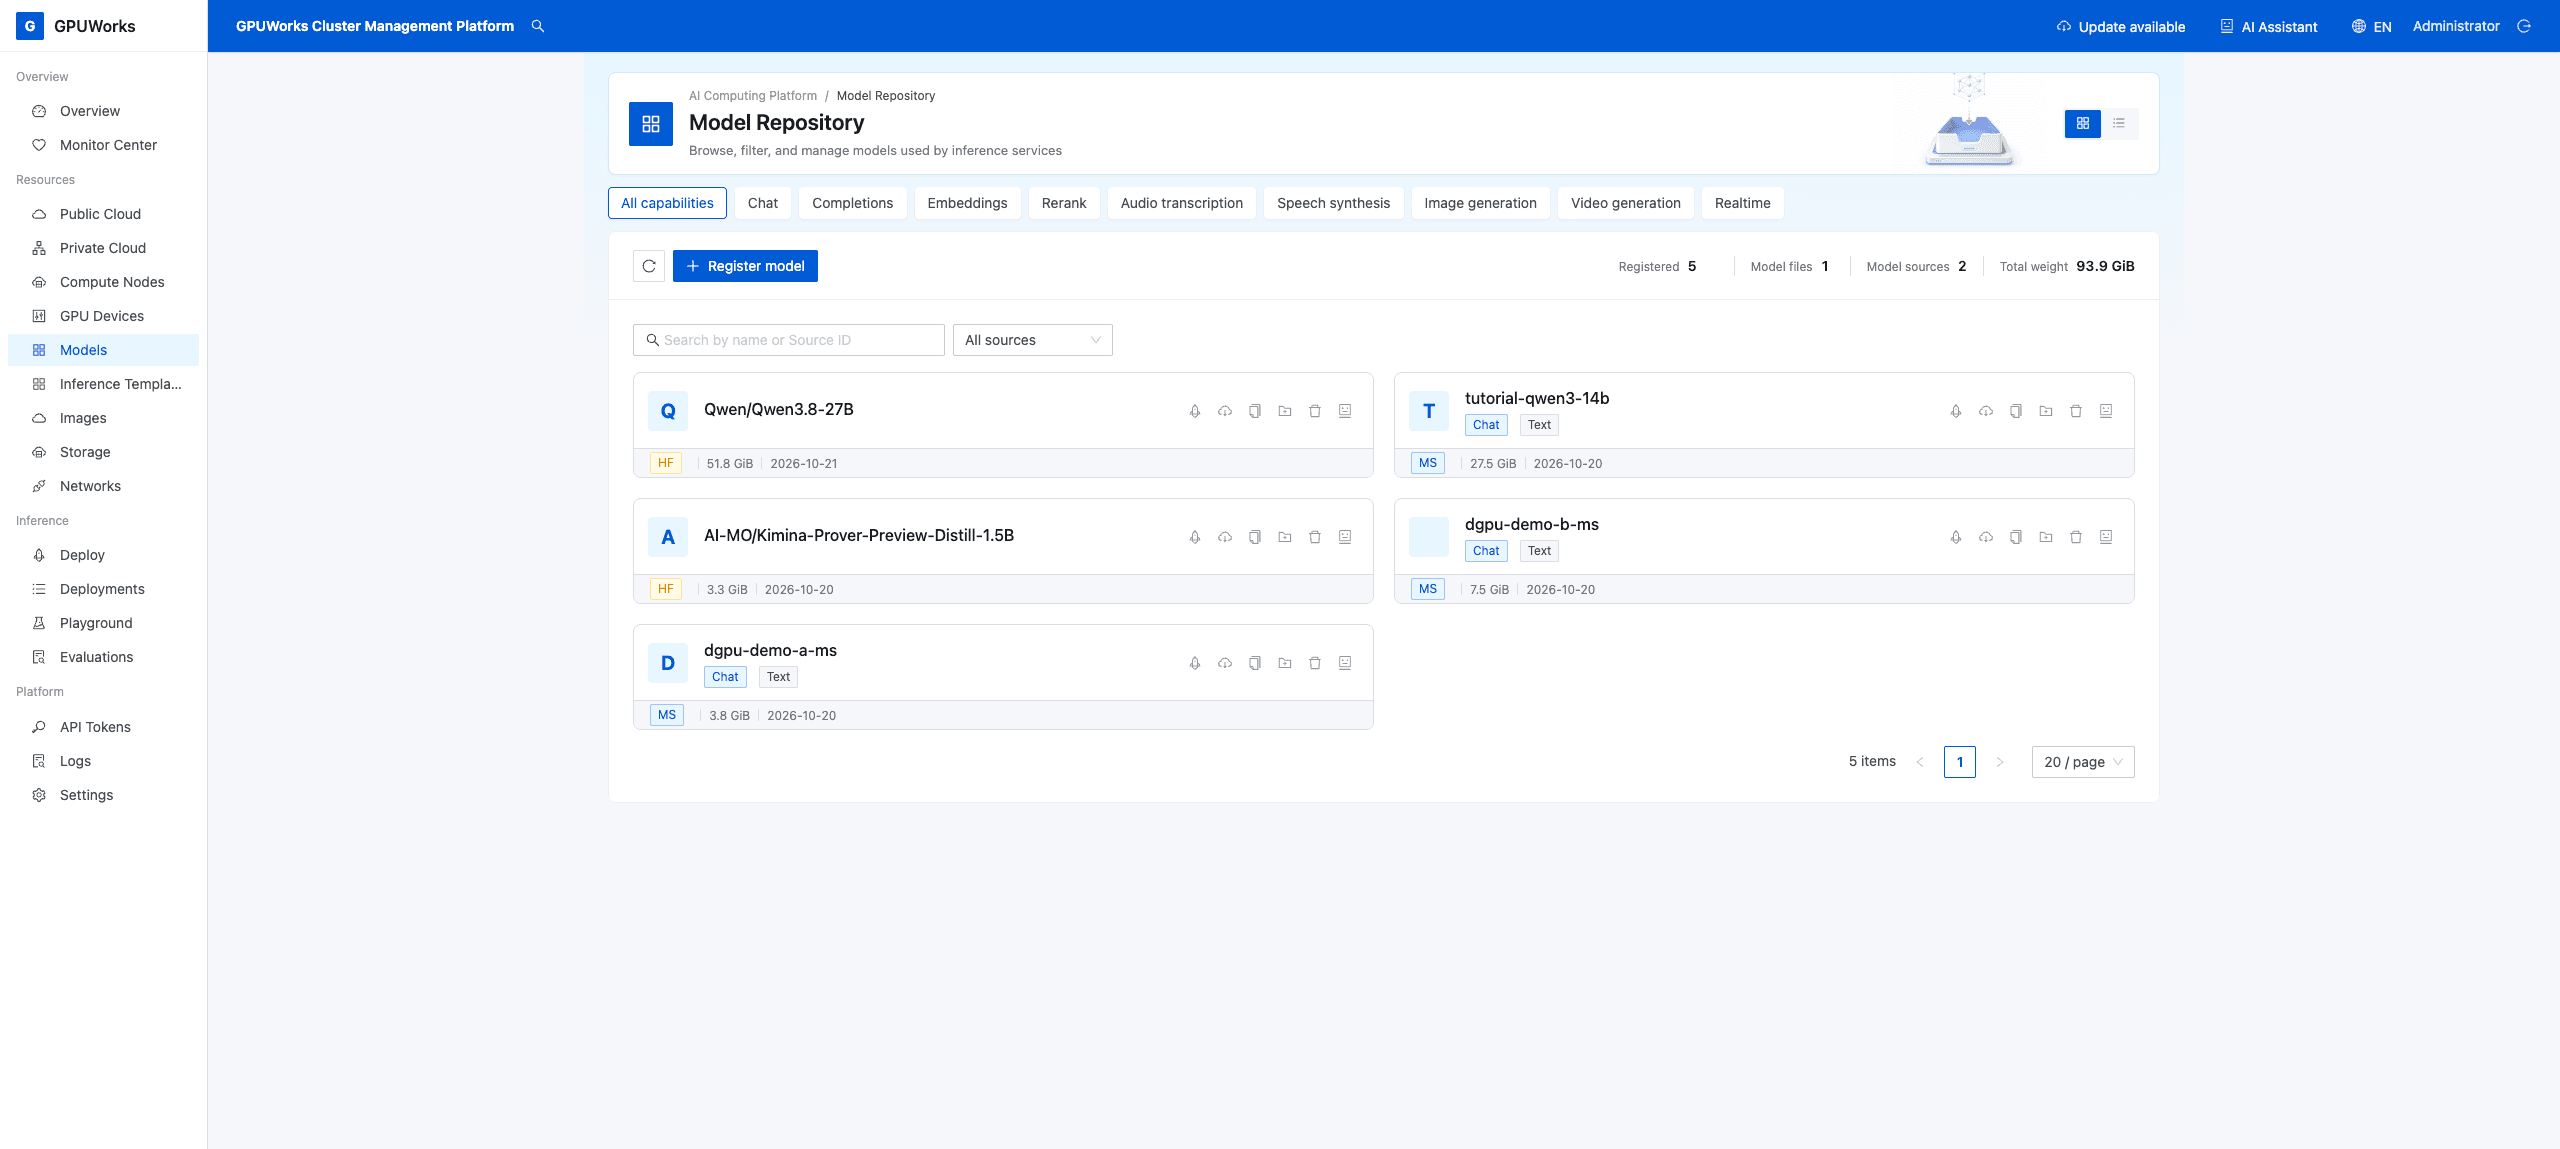
| Model Repository | /models, alias /ai-store/ai-model | Browse and filter registered models; switch between card and list views. “Register model”, “Refresh models” (reload the list), and per-row actions to download to compute nodes, sync to other compute nodes, “Register an existing path on a node”, and “Delete model” | Download, Cache, and Sync Models Between Nodes, Import Models and Images from an HTTP File Server |
| Inference Templates | /inference-templates | Browse deployable model specs in the flat catalog. The page groups them by “Model Organizations” and lists “Weight artifacts”; filtering by “Chip models” starts only after you select chips. “Import Templates” imports your own templates (flat YAML or a .gpuworks-catalog.tar.gz catalog package with assets/documentation); “Edit chips” adds or removes hypothetical models used for filtering; environment-detected models are read-only. Configure the template catalog source URL and sync under the inference template and default model source settings in “Settings” | Inference Catalog model.yaml Syntax Reference, Executable Inference Catalog Packages |
| Inference template details (secondary page, titled with the model name) | /inference-templates/* | Specs for one model, including scenario, quantization, target hardware, and image. Each spec offers “Deploy” (opens /deploy?template=…). Custom specs can be edited or deleted: the server generates the flat YAML in the “Edit” drawer in catalog format, without assembling it in the browser, so saving it unchanged preserves all fields; built-in templates list only their custom specs in this editor. “Clone” copies the template into your own template and opens this YAML directly. “Usage” in a spec's “Details” drawer also includes invocation examples for each API and “Open in Playground” | Inference Catalog model.yaml Syntax Reference, Deploy Models, Select GPUs, and Understand Scheduling Results |
| Images | /images | Manage runtime images by family, version, and node distribution. Three tabs: “System”, “Community”, and “Custom”. “System” is read-only (no editing or deletion; versions can be enabled or disabled), with “Check for updates” and “Upload manifest”. Versions removed from the manifest but still referenced display “Deprecated · N references”. The “Add Community Image” drawer under “Community” lists built-in community repository cards and can list all upstream tags from any repository, searchable by name. “Custom” offers “Add Custom Image” for arbitrary references, with engines including callable and vllm-omni; the add drawer can also parse a docker save archive from a URL. Delete community/custom images in their detail drawers. The node distribution table shows image IDs (12-character digests) and update times. On nodes, pull images, sync them from other nodes, or fetch them from a URL; rolling tags offer “Pull again” | Image Catalog and Inference Image Families, Deploy in Offline Environments, Import Models and Images from an HTTP File Server |
Inference
Manage deployed services in “Inference Services” and create new ones with “Create Deployment” in its header; run large offline jobs in “Batches”, verify in “Playground”, and quantify performance in “Evaluations”.
| Page name | Path | Purpose | Further reading |
|---|---|---|---|
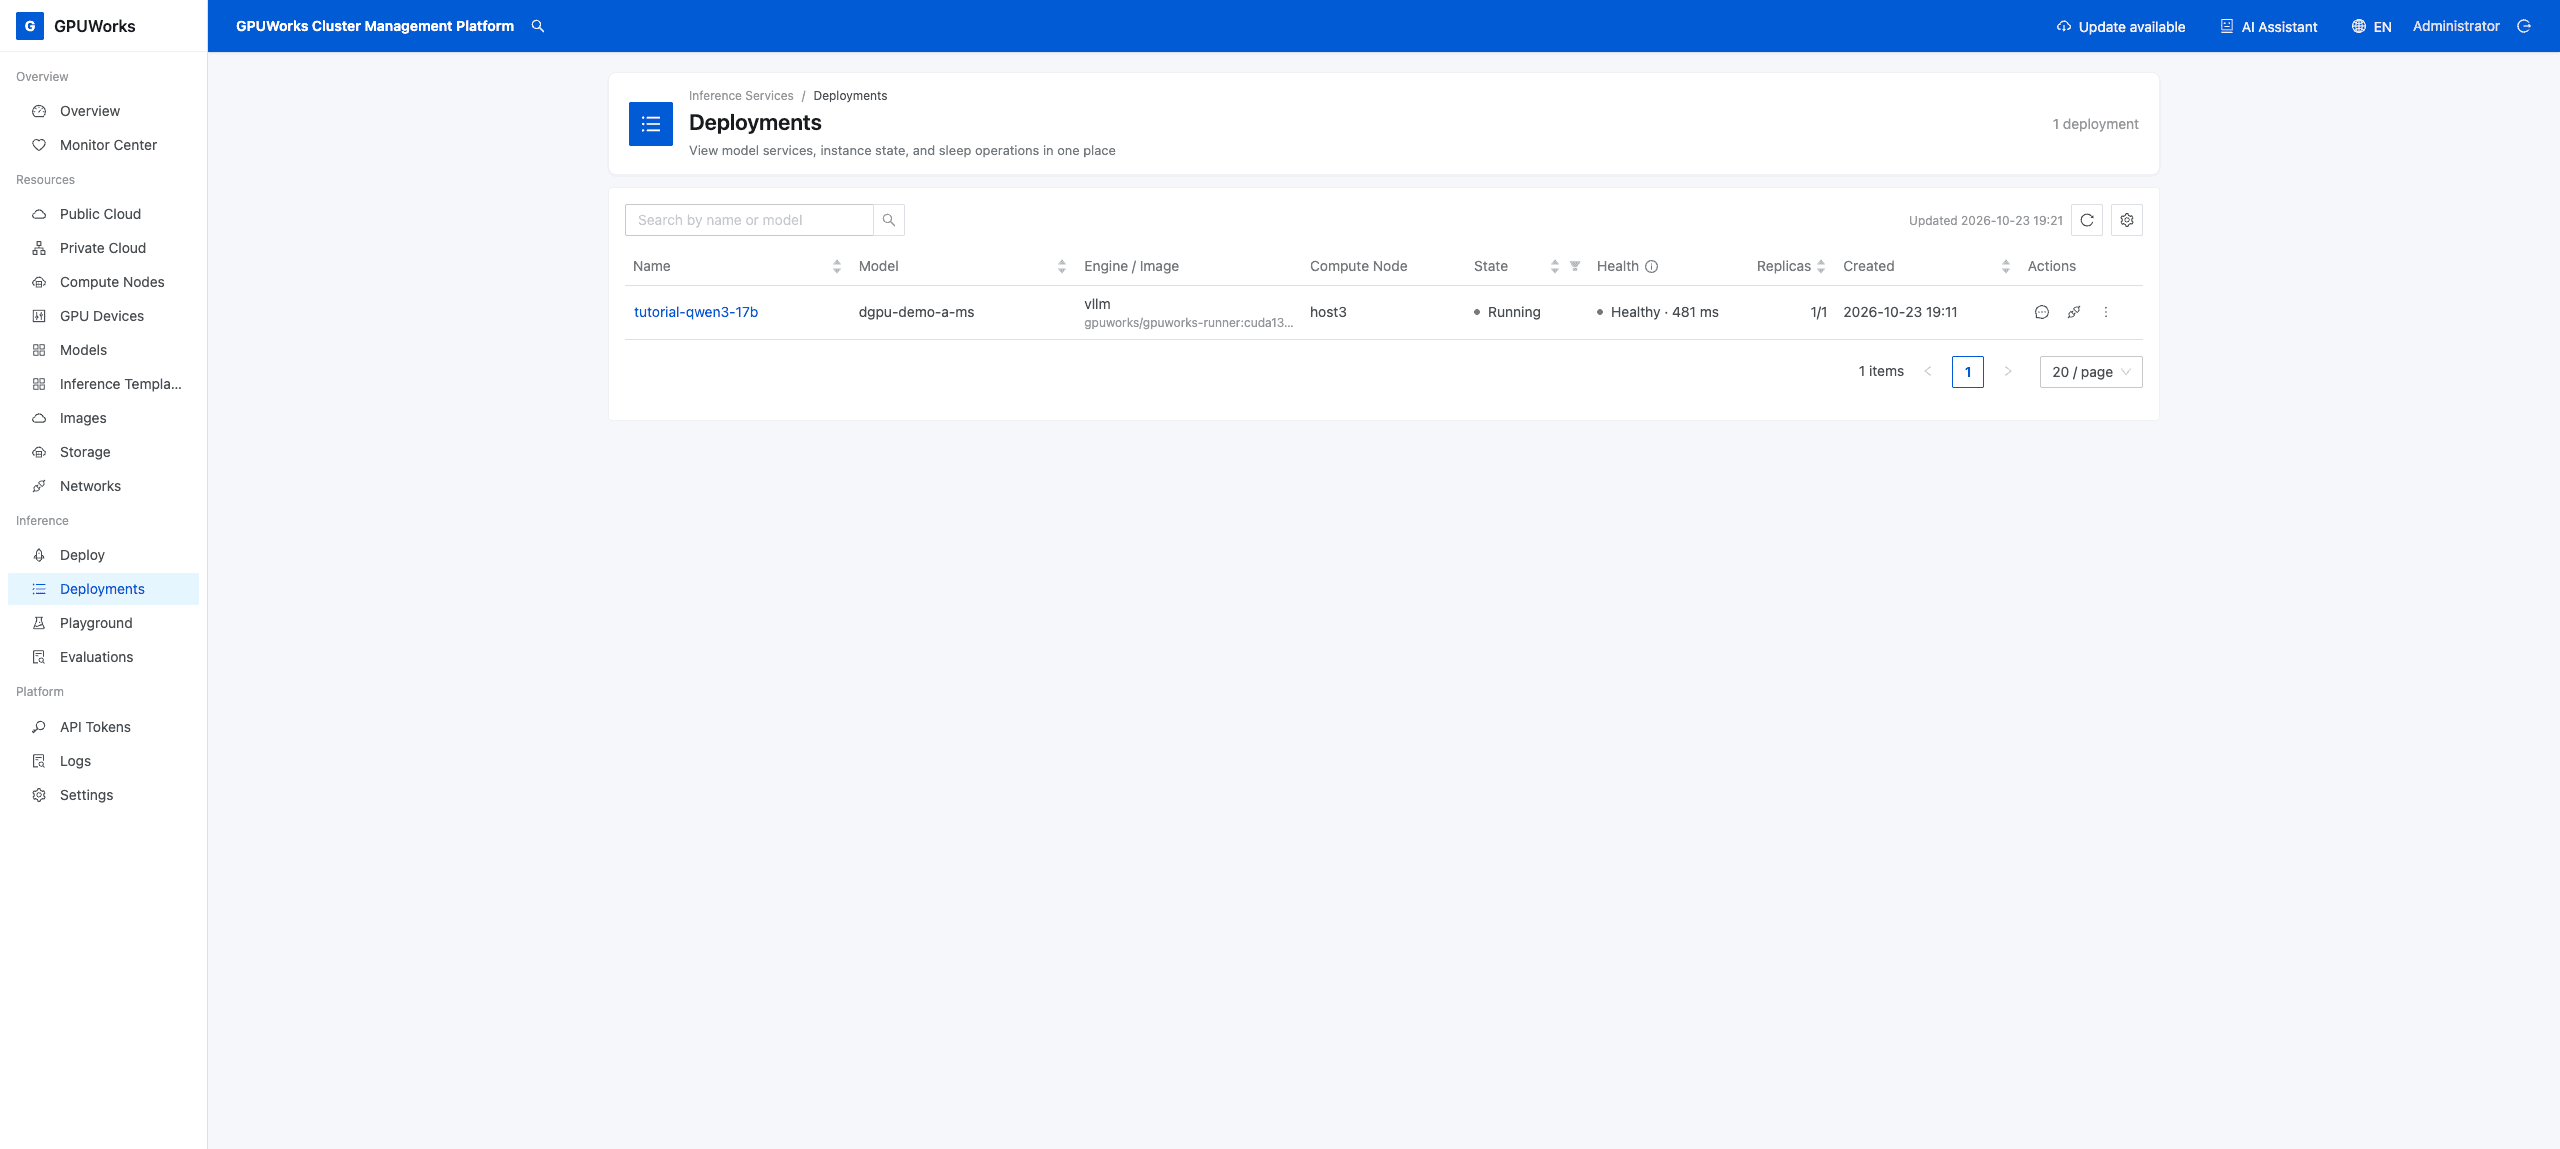
| Inference Services | /deployments | View model services, instance status, and sleep operations in one place. “Create Deployment” in the header opens the Deploy page. Each row offers “Open Playground”, “Copy curl”, and copying the API endpoint. “More” includes “Clone Deployment”, “Start Benchmark”, “Save as Inference Template”, instance terminals, and deletion. The detail drawer contains “Deployment Details”, instance events and logs, “Environment & Mounts”, “Launch facts”, and “Per-GPU Telemetry” (dGPU instances show their own slice's memory/limit and SM reference; whole-card figures include other instances on the same card and are provided for reference). PD deployments also have “PD Disaggregation” | Deploy Models, Select GPUs, and Understand Scheduling Results, Put Instances to Sleep and Wake Them |
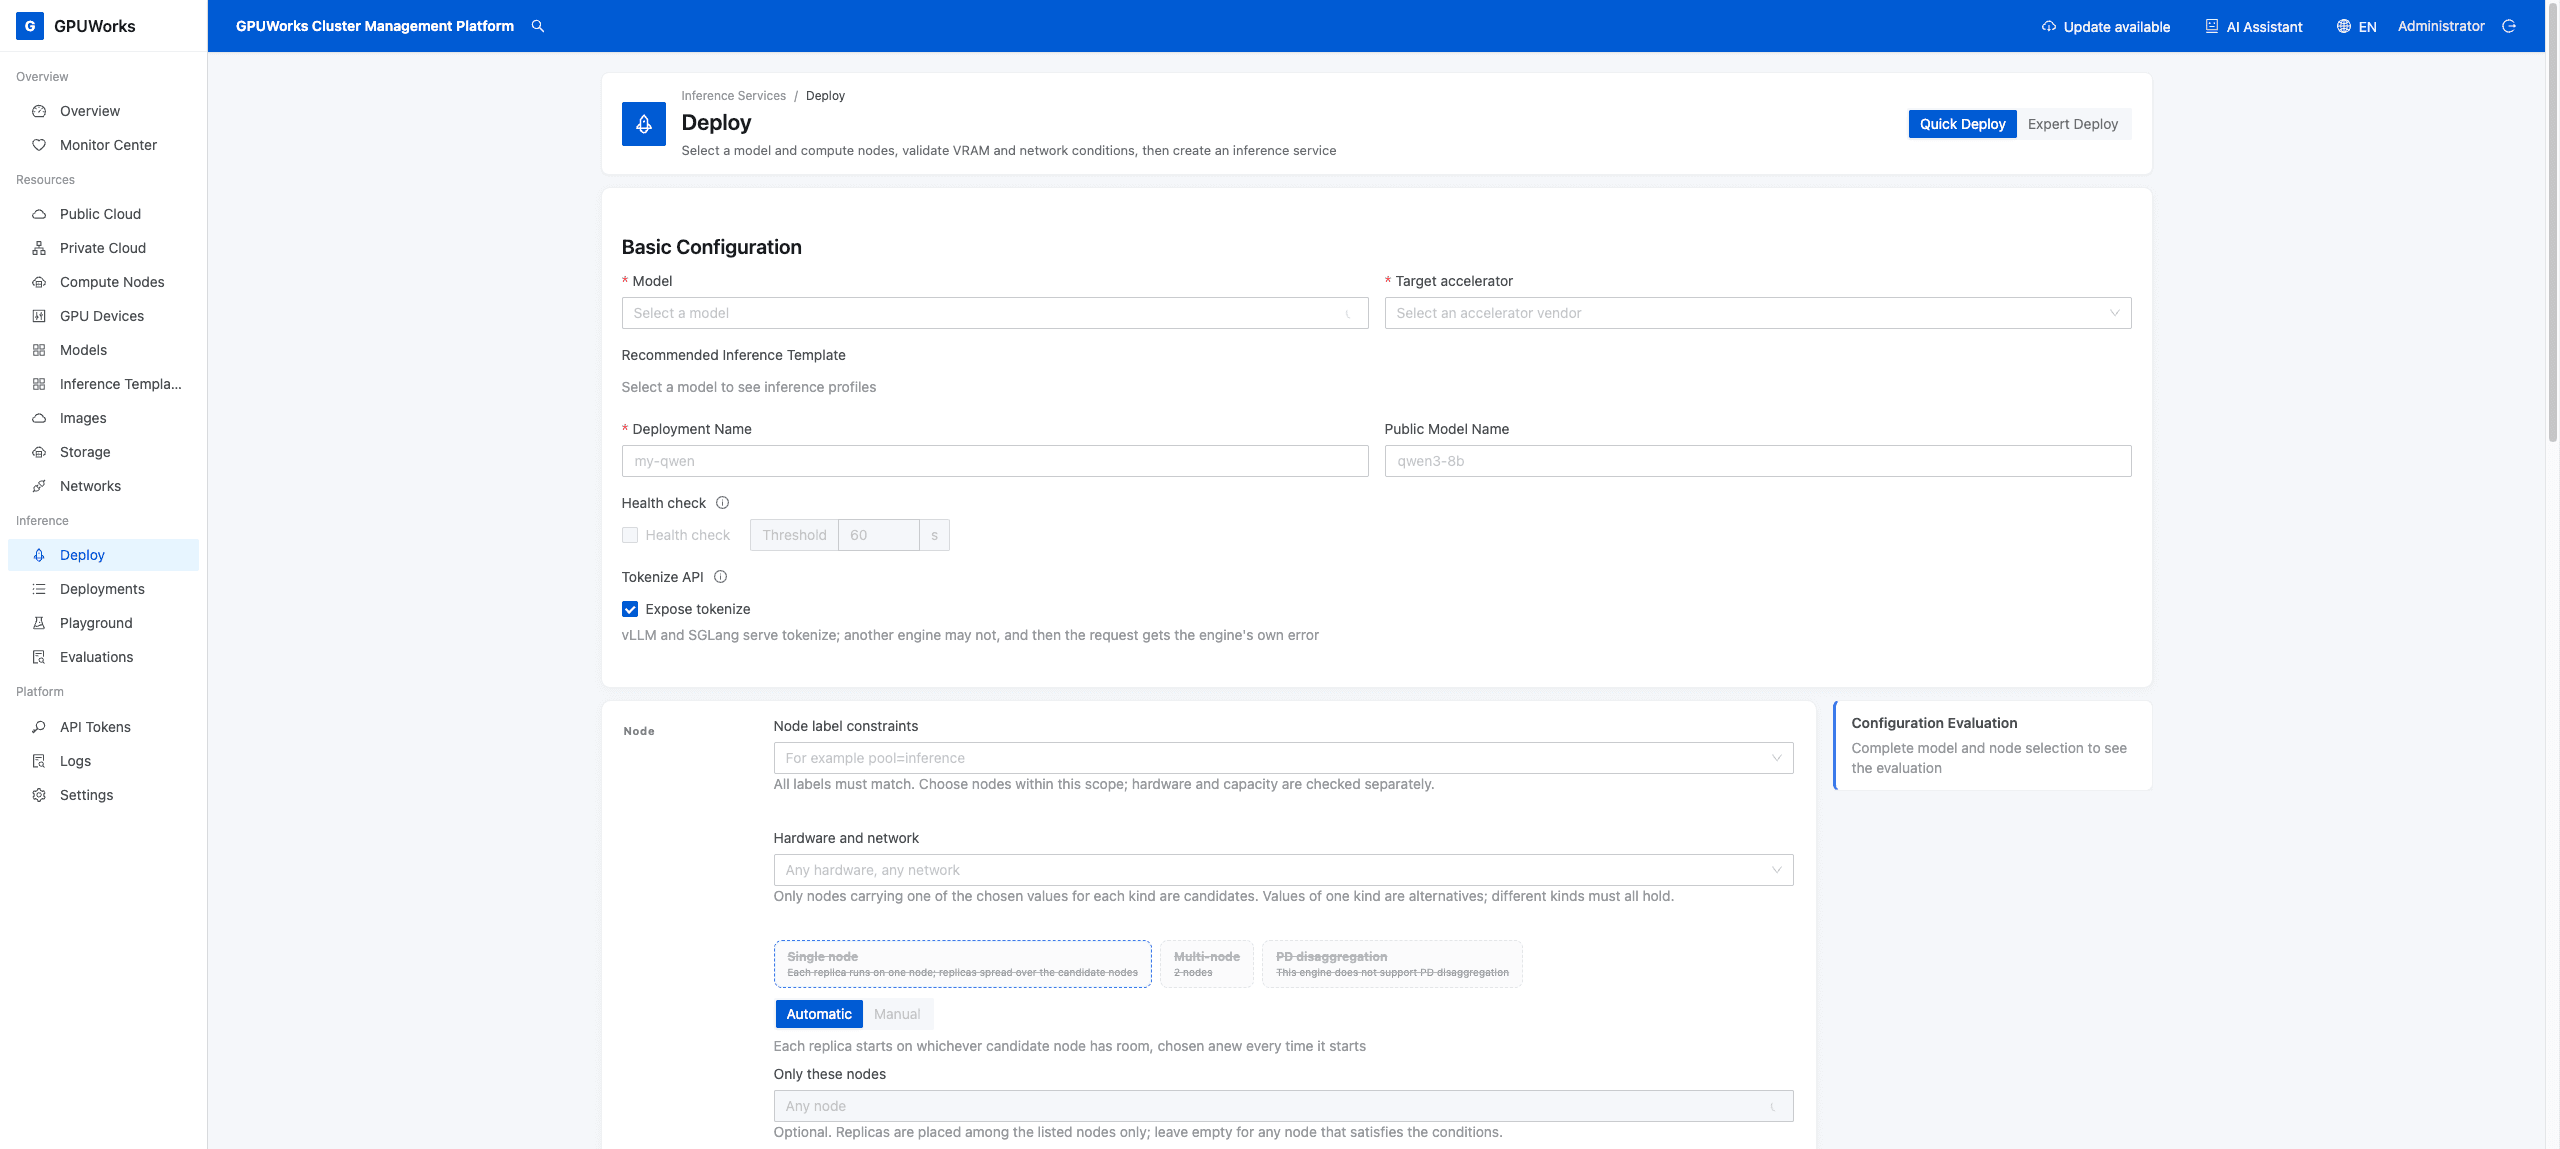
| Deploy (secondary page, opened from “Create Deployment” in Inference Services) | /deploy | Select a model and compute nodes, validate GPU memory and network requirements, and create an inference service. Two modes: “Quick Deploy” and “Expert Deploy”. Expert mode has “Model and Context”, “Performance”, “Resource Configuration”, and “Runtime Environment” tabs, with “Configuration Evaluation” on the right. With parameters such as ?template=, the title becomes “Deploy Template: …” and “Clone Template” is available | Deploy Models, Select GPUs, and Understand Scheduling Results, Multi-Node Inference, PD Disaggregation Deployment, Scheduling and GPU Memory Estimation |
| Batches | /batches | Run large sets of requests asynchronously: the list shows each batch's status, endpoint, progress (with the failure count), and creation and expiry times, and can be filtered by status; click a row to open the detail drawer, with the summary, request counts, timeline, and metadata, downloads of the input, output, and error files, and “Cancel batch” (confirmed in the page); “Create batch” uploads a JSONL file (the endpoint is the lines' url), and creating and cancelling are administrator-only | Run Batches, OpenAI-Compatible Gateway |
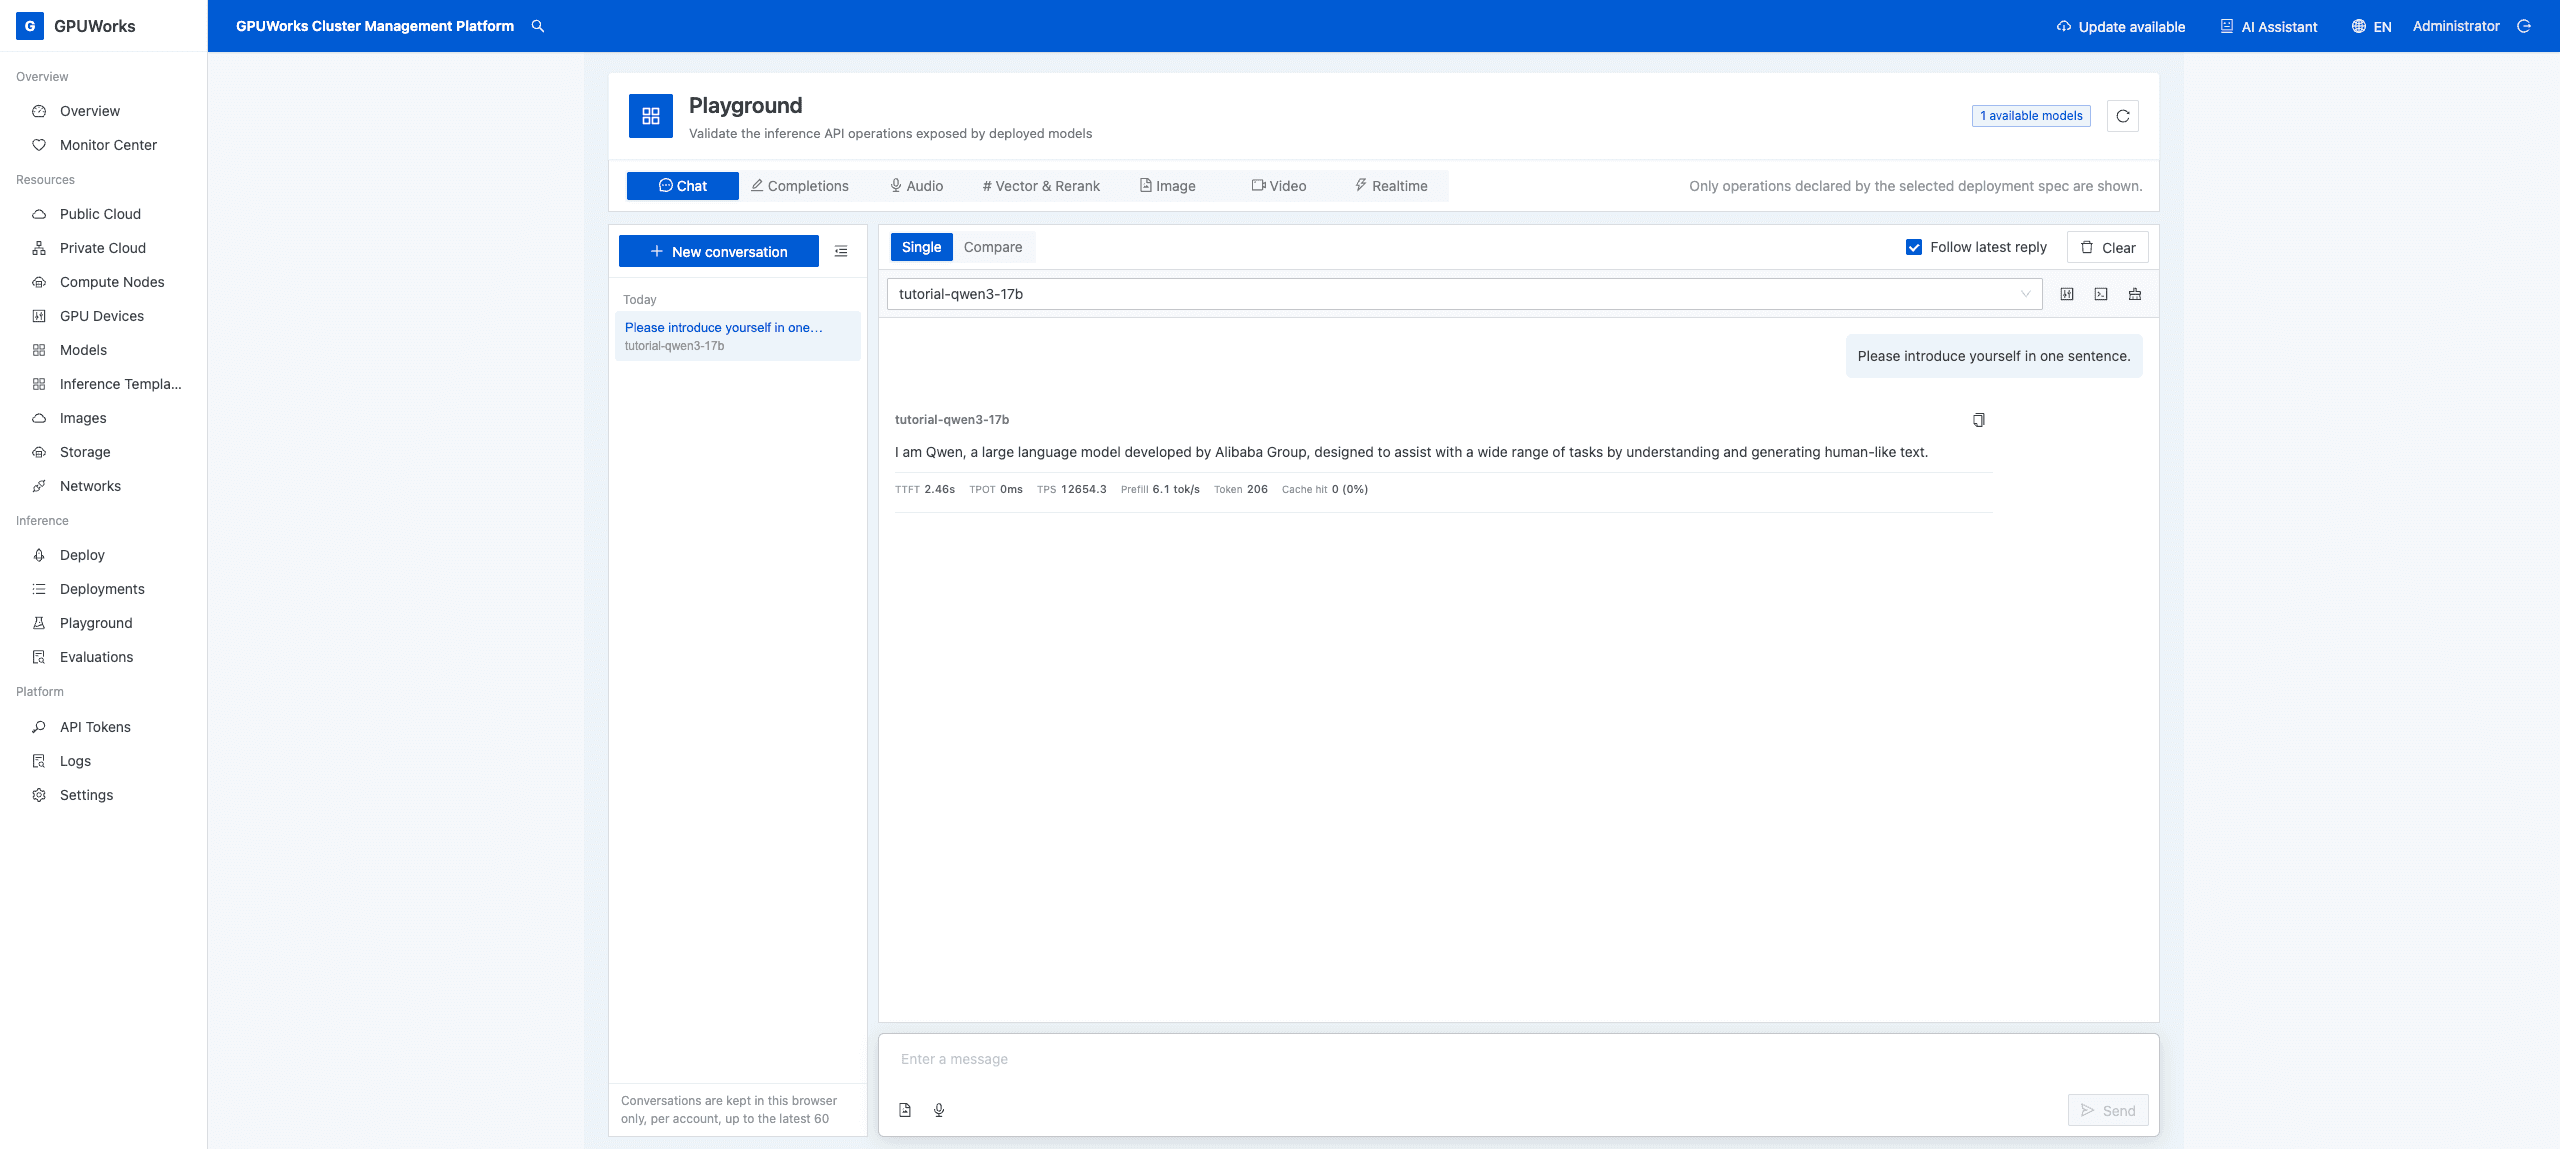
| Playground | /playground (the menu opens /playground/chat) | Verify deployed models' inference API capabilities. Shows only APIs actually declared by the selected deployment spec. “Refresh Models” is in the upper right; the chat page offers “View Code”. TTFT, TPOT, TPS (single-request decode speed = 1000 / TPOT, excluding prefill), Prefill, and Token below each response update live during generation. If the endpoint does not report usage with each chunk, token counts are estimated from chunk counts and marked “≈”. “Stream options (stream_options)” in the “Parameters” panel lets you disable include_usage and continuous_usage_stats. When the selected model is asleep, the chat, audio and realtime pages share one notice: for a sleep the platform made (yielding cards) it reads “The model is asleep; sending a request wakes it, and the first one waits a few seconds longer.”; for a sleep by hand or by a schedule it reads “The model was put to sleep by hand or by a schedule, so a request does not wake it. Wake it first.” (the chat page has a “Wake” button; on the audio and realtime pages wake it from the Inference Services page) | OpenAI-Compatible Gateway, Install GPUWorks and Deploy Your First Model |
| Playground · Chat | /playground/chat | Chat completions. The conversation list on the left supports creating, switching, renaming, deleting, and collapsing conversations; a comparison is also a conversation. Conversations are stored in this browser's IndexedDB, isolated by account, with the latest 60 retained. Switching models preserves context, and each response identifies the model that answered. Leaving Playground or switching between single chat and comparison does not interrupt generation; refreshing or closing the tab does, and the response is marked “Interrupted” when you return. Up to 4 responses can generate concurrently over HTTP/1.1 and 12 over HTTP/2/3; exceeding the limit rejects the entire generation attempt. “Follow latest reply” at the top is selected by default, clears automatically when you scroll up, and is selected again when you send a message. Copy code blocks or entire responses, including on HTTP deployments. HTML/SVG code blocks offer “Preview”, rendered in an isolated environment in the right drawer with network requests blocked by default | Same as above; for preview isolation, see Security Model and Trust Boundaries |
| Playground · Completions | /playground/completion | Text completions API (/v1/completions): sends the prompt unchanged, without a chat template, and streams the continuation and token count | Same as above |
| Playground · Audio | /playground/audio | Audio APIs | Same as above |
| Playground · Vector & Rerank | /playground/vector | Embedding and reranking APIs | Same as above |
| Playground · Image | /playground/image | Image generation API | Same as above |
| Playground · Video | /playground/video | Video generation API | Same as above |
| Playground · Realtime | /playground/realtime | Realtime API | Same as above |
| Playground · Decision | /playground/decision | System One decision API (/v1/systemone): starts from the server's example; edit the state (text or JSON), images (when the model declares image input) and questions (yes/no, choice, score); each question's result shows its option probabilities, decision and confidence | Same as above |
| Evaluations | /evaluations | Evaluation history list: “New Evaluation” wizard (“Choose Question”, “Set Target”, “Configure Load”); view, “Run Again”, and “Delete” on each row; select multiple evaluations to compare them (up to 5) | Run Evaluations and Interpret Reports |
| Evaluation details (secondary page, titled with the evaluation name) | /evaluations/:id | Verdict summary for a single evaluation, “Target Under Test”, the “Point Results” table and curves, and report export | Run Evaluations and Interpret Reports |
| Evaluation comparison | /evaluations/compare | Align multiple evaluations across modes by concurrency (arrival rate for open-loop points). Data without shared points remains as isolated points | Run Evaluations and Interpret Reports |
Administration
Access credentials, log search, and server-level settings.
| Page name | Path | Purpose | Further reading |
|---|---|---|---|
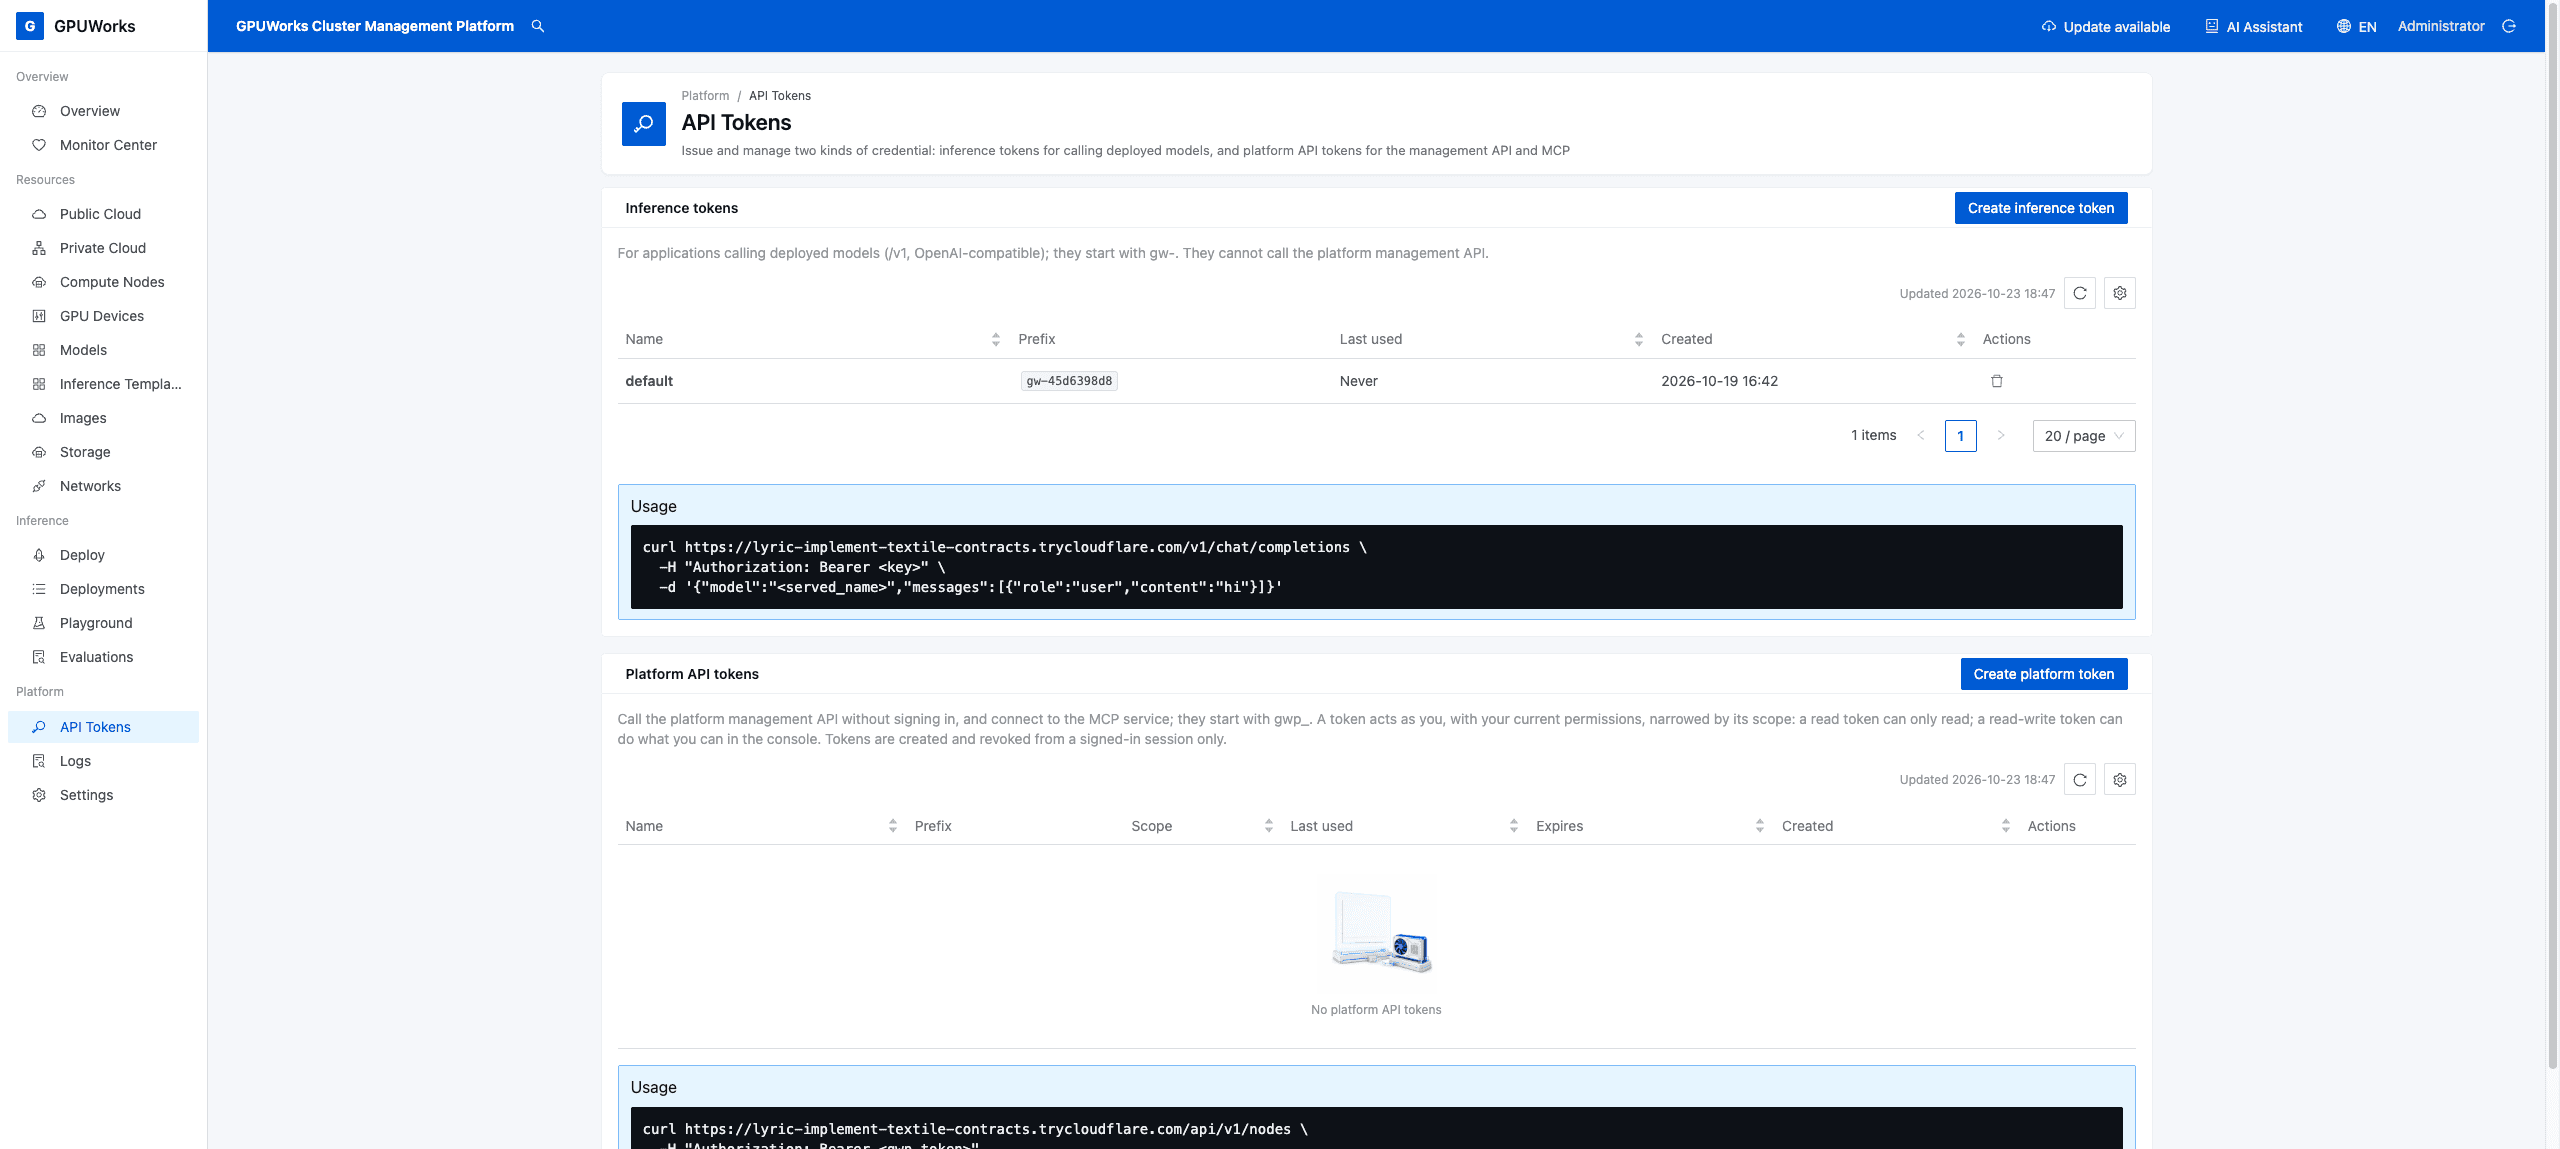
| API Tokens | /apikeys | Two cards: “Inference tokens” (gw-, for downstream applications to call deployed models) and “Platform API tokens” (gwp_, for calling management APIs and MCP as yourself, with read-only or read/write scope, optional expiry, and revocation). Both display the plaintext token only once after creation | OpenAI-Compatible Gateway, Connect Through MCP, Security Defaults Checklist |
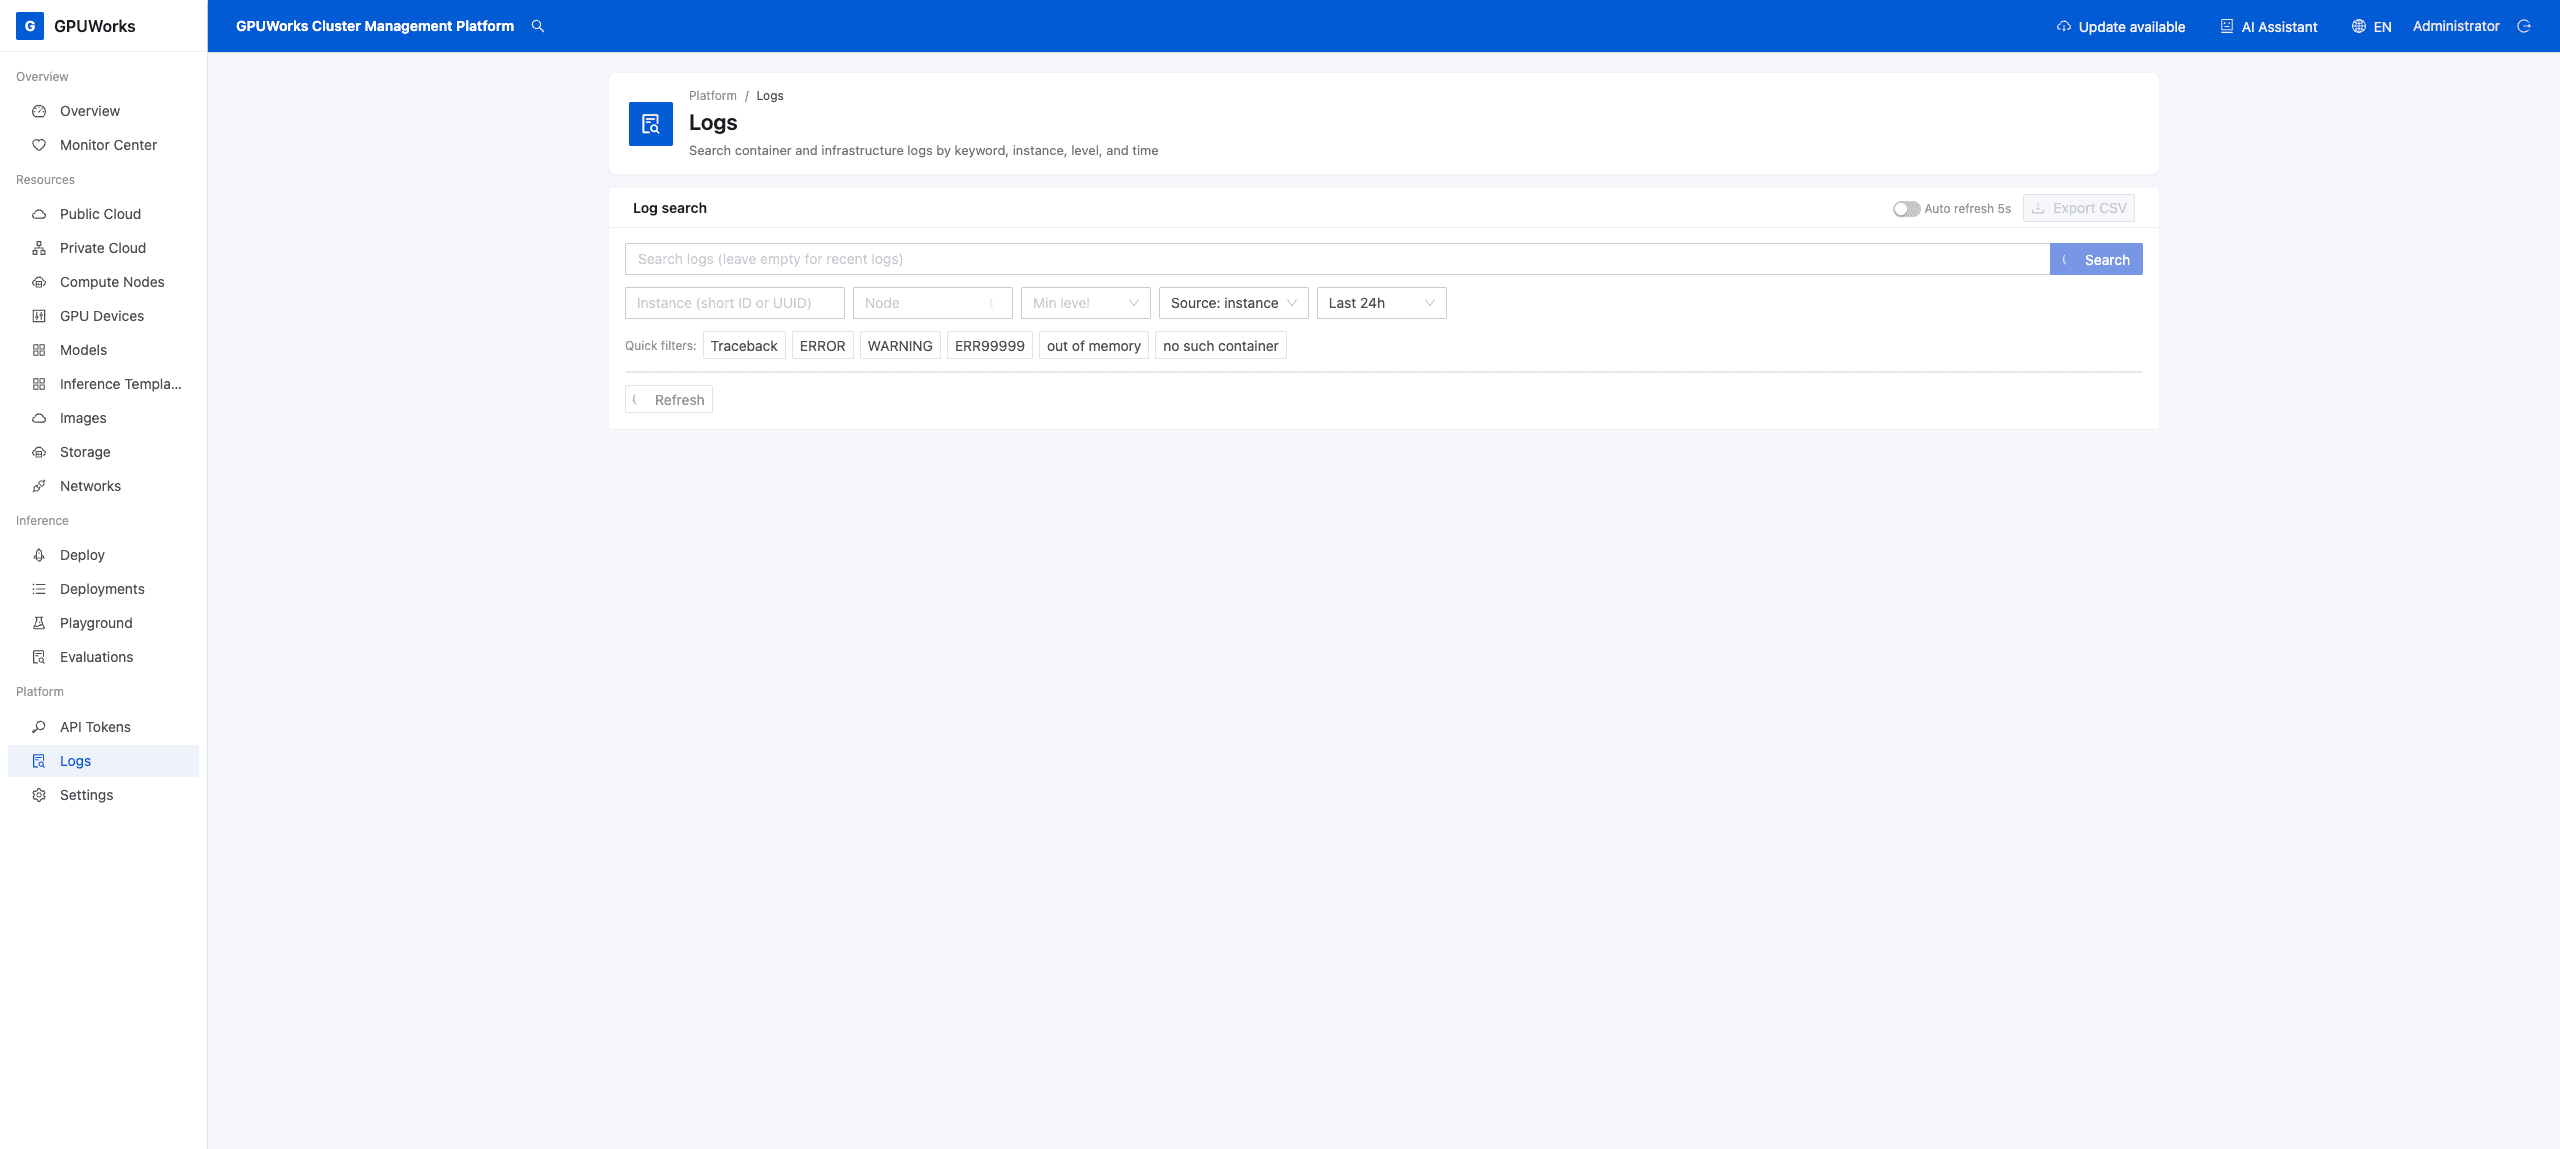
| Logs | /logs | Search container and infrastructure logs by keyword, instance, level, and time (“Log search”) | View Metrics and Search Logs |
Settings
Path: /settings. The page has six tabs. URL fragments #general, #pull, #nodes, #access, #integrations, and #data select the corresponding tabs. A card's own fragment (such as #updates, #security, #telemetry, #pull-settings, or #data-retention) opens the tab containing that card.
General
- Branding: Set the logo, product name, top bar title, and sign-in page introduction. Leave fields empty to use the built-in defaults. Only administrators can change these settings.
- Selecting an image opens a cropping page with the whole image selected by default. Drag, zoom, or select a new crop; select “Crop to a square” to lock a 1:1 ratio and preview the actual sidebar appearance.
- After confirmation, the browser resizes the image to within 256 pixels and compresses it. Small, uncropped SVG files are kept unchanged.
- Display locations: The product name (default
GPUWorks) appears beside the sidebar logo. The top bar title appears at the upper left (defaults to the product name followed by “Cluster Management Platform”, localized to the interface language). The browser tab title and icon also follow the product name and logo. The left side of the sign-in page displays the logo, product name, and introduction. Custom text appears unchanged and is not translated when the interface language changes.
- Version and updates: View and update the server, system image catalog, and inference template catalog.
- Choose the stable release or rolling preview update channel.
- “Check for new versions automatically” controls whether the server checks automatically. When enabled, checks report the installation identifier, server version, and agent version distribution to the publisher. They additionally report the node count and GPU models only when the User Experience Improvement Program is enabled. Disabling automatic checks stops these checks and their associated reporting; the program's daily reports are controlled separately.
- Current and latest values are displayed separately for the server, system image catalog, and inference template catalog.
- Update either catalog with one click or by uploading a file. Upgrade the server from the console or upload an upgrade package; when this is unsupported, an upgrade command is provided.
- Header notification: When automatic version checks are enabled, opening the sign-in page starts a server update check (the server checks externally at most once per hour per channel; the sign-in page itself does not show the results). After sign-in, “Update available” appears in the header when the server or an official catalog has an update. Click it to open “Version and updates” in Settings.
- Listen addresses: Written to
server.yaml.
Image & Model Pulls
“Pull settings” has four tabs:
- Source rules: Image rules and model site rules; the site rule drawer offers “Test connectivity”.
- Proxies: Ordered proxy entries and “Preview the proxy a node uses”.
- Sync groups.
- Credentials: Image registry and model site credentials.
See Configure Image and Model Pulls.
Nodes & Deployments
- SSH Key: The platform SSH key.
- Deployment: Cluster default for the instance startup timeout.
- Orphan Container Cleanup.
Security & Access
- Security: two switches, both administrator-only. One allows Playground HTML previews to make network requests; the other, "Accept /v1 inference requests without a token" (
inference_open_access, off by default), lets/v1accept requests that carry no inference token while a request that presents one is still verified. See Gateway Authentication. - Web Terminal: Enable/disable, idle timeout, and concurrency limit.
- MCP service: Enable/disable, endpoint, and connection examples. Only administrators can change the toggle.
Integrations
- AI Services.
- Request trace export (OpenTelemetry): Collector address, encrypted headers, sampling ratio, trace links, test spans, and runtime status. Only administrators can change these settings; see Export Request Traces to OpenTelemetry.
Data Retention
Set retention periods for raw metric samples, container logs, individual request records, token usage, and long-term statistics. Individual request records also have a storage limit. The page includes toggles for three types of long-term statistics and a statistics time zone, with current storage usage shown beside each item.
Shortening a retention period requires confirmation. Data beyond the new retention period is deleted in the background. Only administrators can change these settings; see View Usage Analytics.
Further reading: Install and Upgrade the Control Plane, Configure Node Networks, Configure Image and Model Pulls, Use the AI Assistant, Connect Through MCP, and Configuration and Environment Variables.
Mapping to the API
Every action on a page uses a REST endpoint under /api/v1. See Complete REST API Routes for the full route list. For the fields and decision logic behind upgrade-related UI elements (the “Agent” column and “Upgrade available” badge on the node page), see Upgrades and Version Compatibility.
Was this page helpful?