Tutorials
Run a Performance Evaluation and Read the Report
On this page
Once your model service can answer questions, run a performance evaluation with the built-in Fixed-Length Random workload. This tutorial sends requests to your chosen service at concurrency levels 1, 2, 4, checks the success rate, time to first token, per-user output speed, and overall throughput, and then saves the report.
The screenshots show the English UI. The setup images use a tutorial-performance-random-en draft for the current service; the report image shows the preserved tutorial-performance-random run from 2026-10-20 with the same workload settings.
Before You Begin
- You have permission to view deployments, create evaluations, and download reports.
- You have a running managed chat service that uses a non-reasoning model or has reasoning output disabled. Confirm that it streams answer text normally in Playground → Chat, and note the service name.
- Reserve an exclusive test window and pause other business requests and evaluations for this service. Load generation consumes service resources.
The screenshots and data use tutorial-pd-qwen3-14b, with the Qwen/Qwen3-14B model and vLLM 0.30.0. Reasoning output is disabled for the service. Select your own service as you follow the steps; you do not need to complete another tutorial first.
The platform generates input for Fixed-Length Random. This workload helps you learn to generate load and read reports without preparing or uploading a dataset. Random input does not represent business questions, and this evaluation does not assess answer correctness.
1. Select the Service Under Test
- Open Inference → Evaluations and click New Evaluation.
- In Choose Question, select Parameter Sweep.
- In Set Target, enter the following values and click Next.
| Field | Value |
|---|---|
| Evaluation Name | tutorial-performance-random, or a name of your choice |
| Target | Managed Instance |
| Inference Service | Select the service you confirmed is callable before starting; the screenshot uses tutorial-pd-qwen3-14b |
| Load Origin | Server |
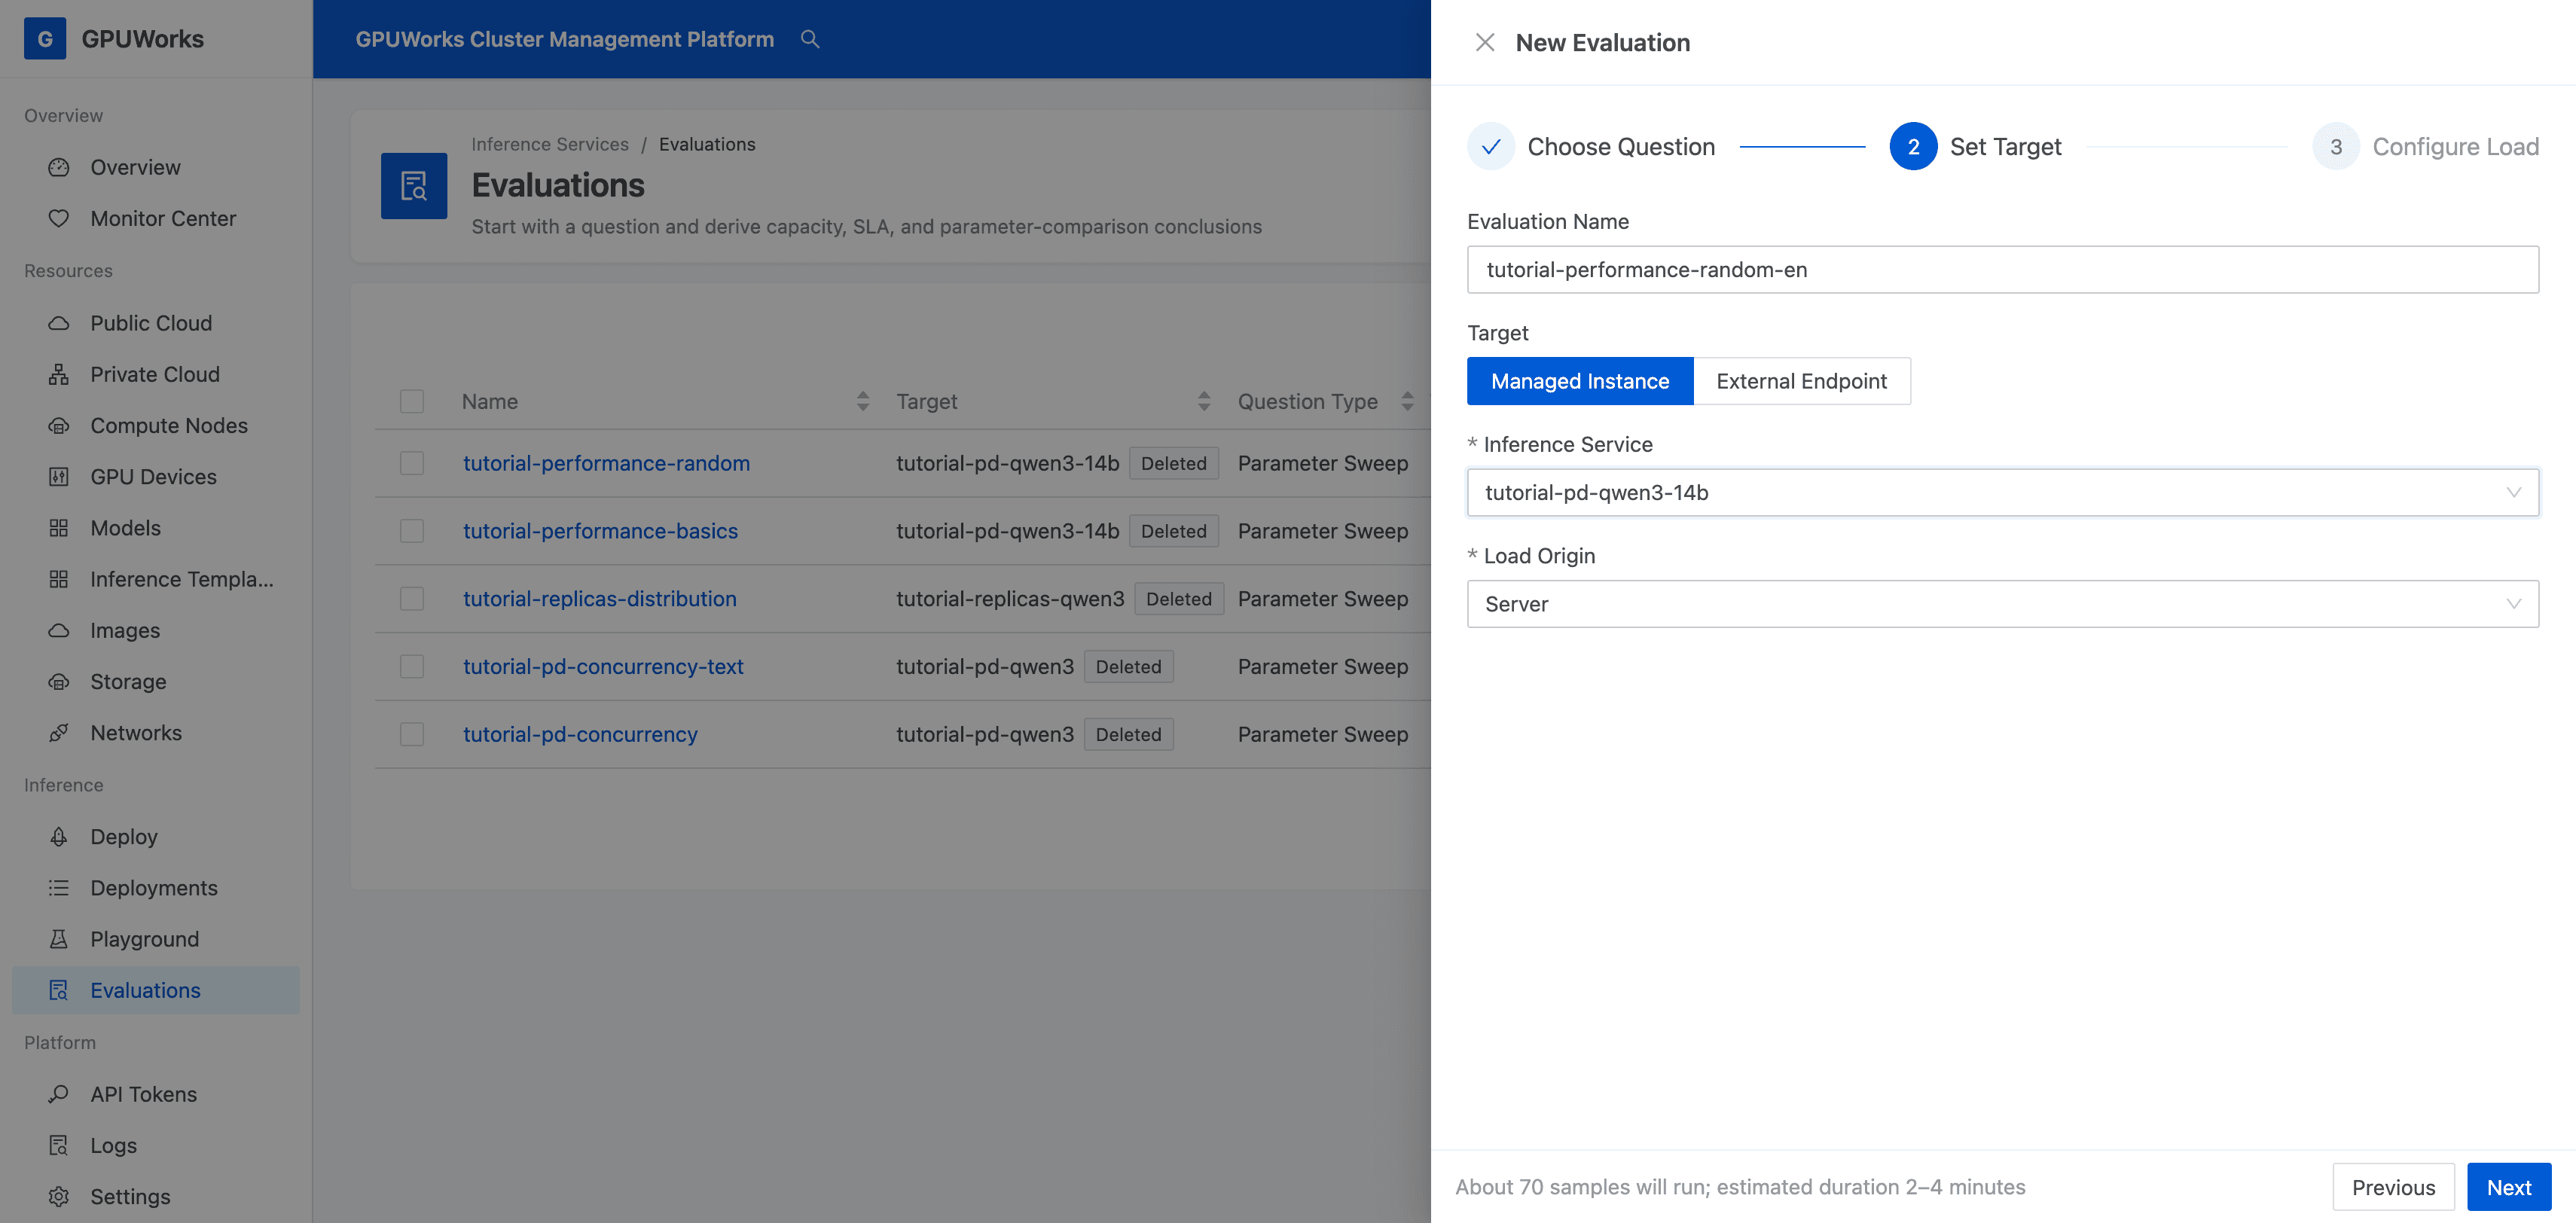
Load generated from Server passes through the service gateway and is then routed according to the deployment mode. The service in this example uses PD disaggregation; standard single-node and multi-replica services also work. If your service is missing from the list, return to its deployment details, confirm that its instances are running and awake, and test a call in the Playground.
2. Configure and Start the Built-In Random Workload
- In Configure Load, set Dataset to Fixed-Length Random and enter the following parameters.
| Field | Value | Meaning |
|---|---|---|
| Input Length (ISL) | 128 | Target number of input tokens per request |
| Output Length (OSL) | 128 | Target number of output tokens per request |
| Samples per Channel | 10 | Each concurrent channel sends 10 requests in sequence |
| Concurrency List | 1,2,4 | Run three points in sequence, with 1, 2, and 4 requests in flight, respectively |
- Expand Advanced Settings and check the following configuration.
| Field | Value |
|---|---|
| Load mode | Fixed concurrency |
| Warmup requests | 1 |
| Fixed output length (ignore_eos) | Selected |
| Keep per-request details | Selected |
| Detail Limit | 20 MB |
| Tokenizer Source | Automatic |
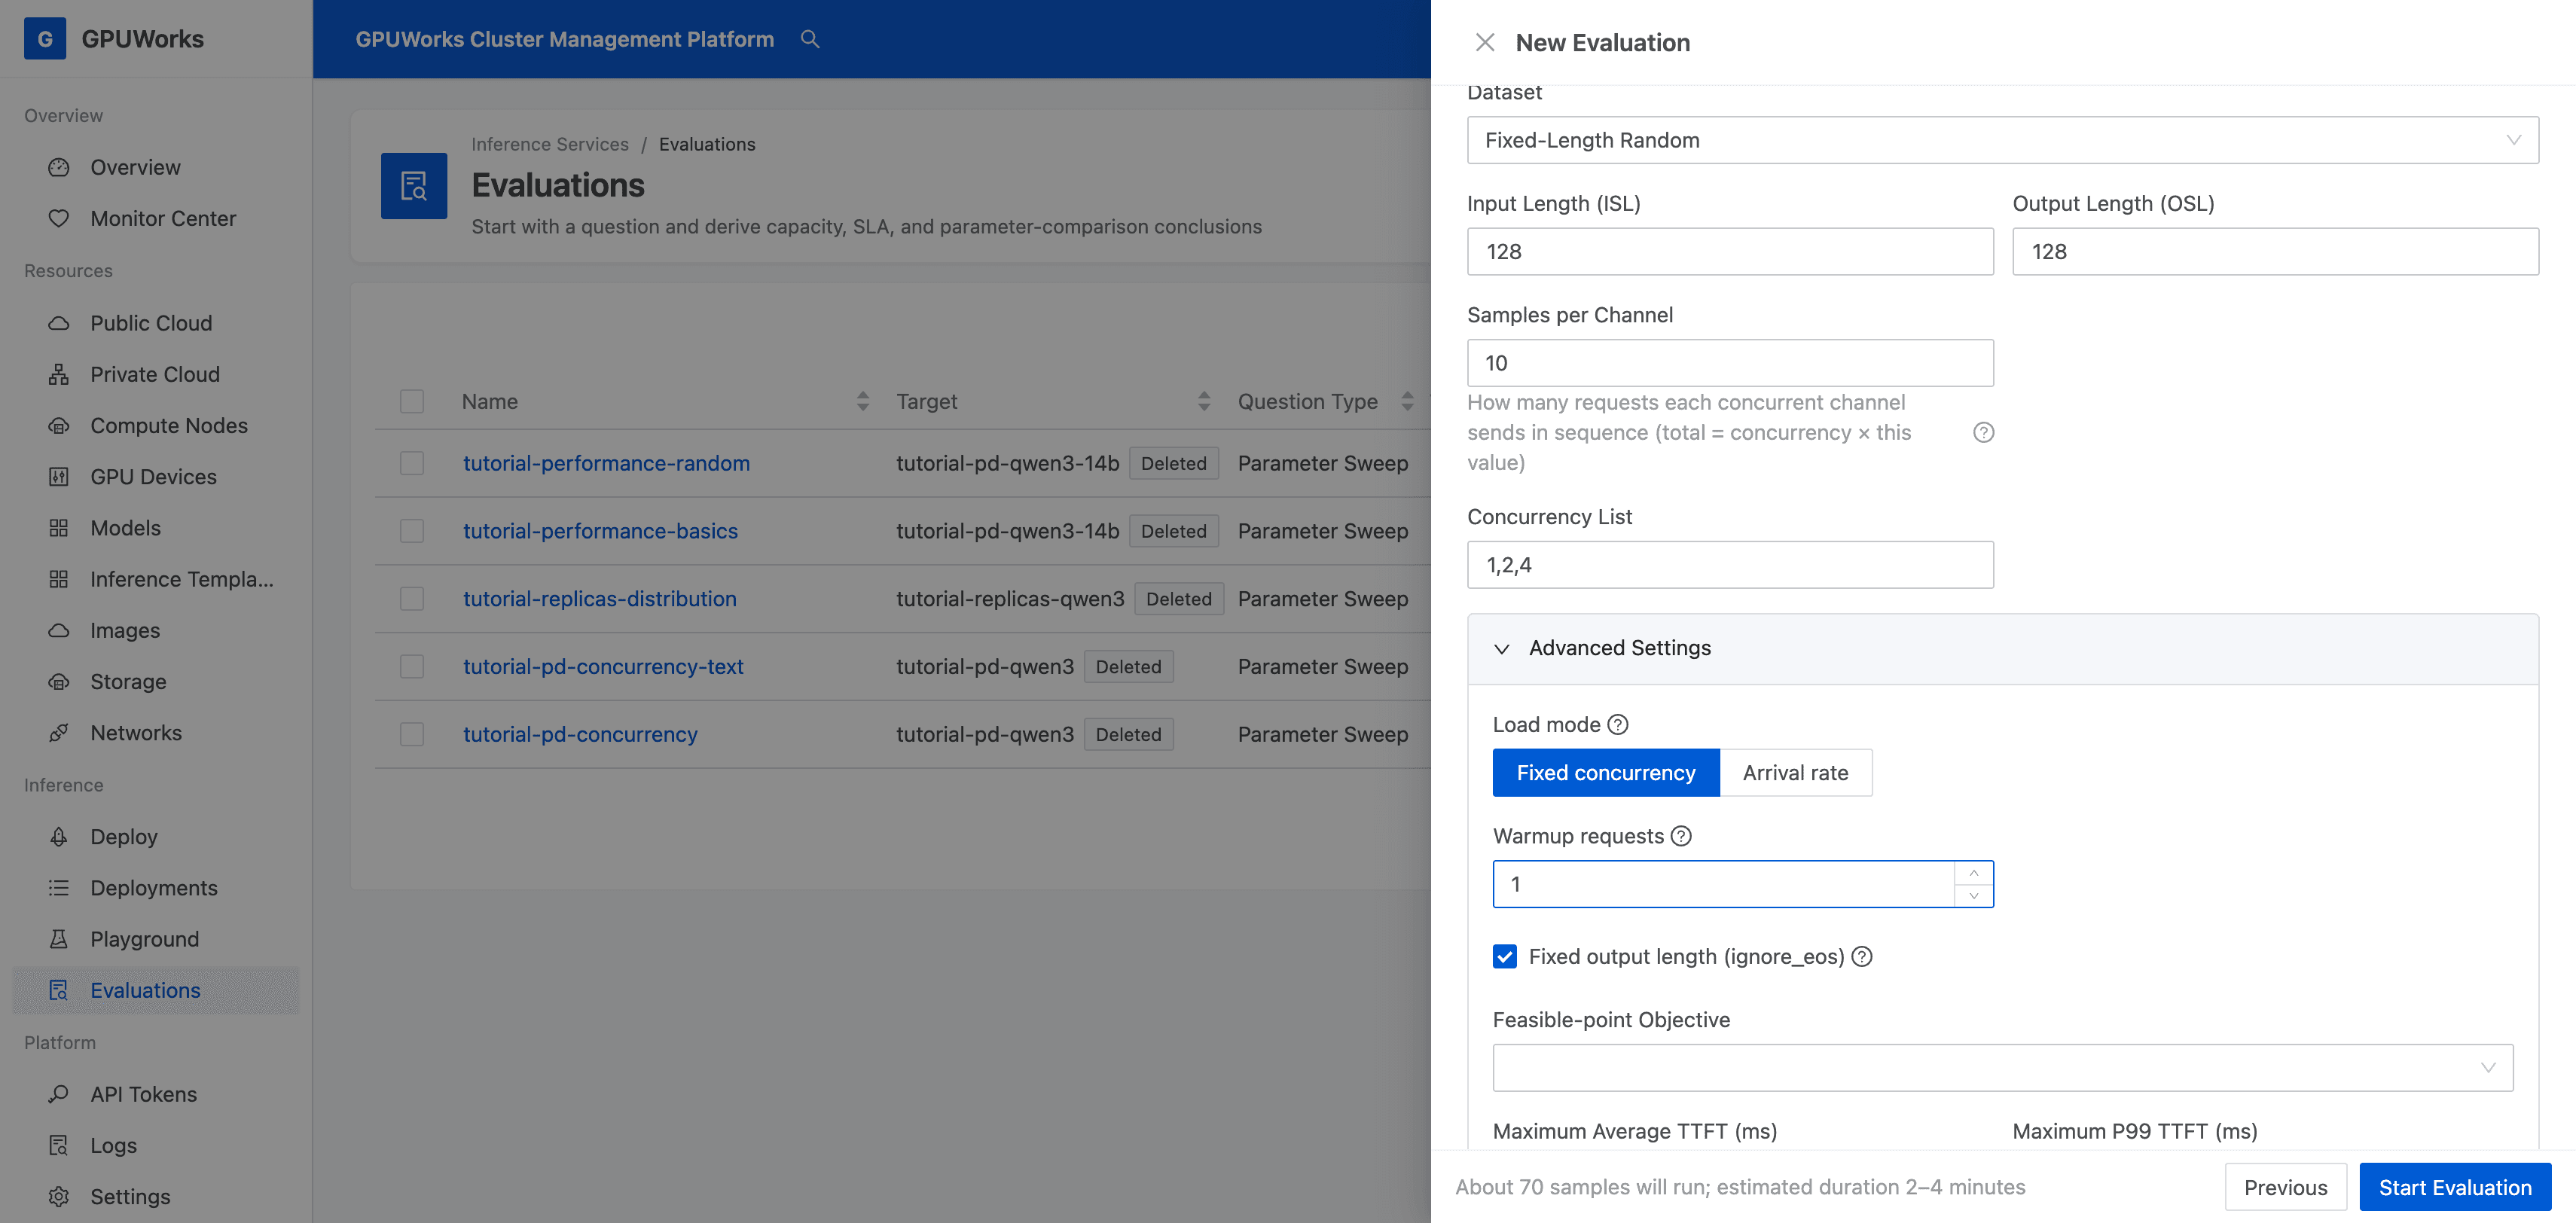
Fixed concurrency sends the next request whenever one completes. The three points send 10, 20, 40 measured requests, respectively, for a total of 70. There is also 1 warmup request, whose results are excluded from the points. Fixed output length asks the engine to ignore early termination signals and generate the target length.
Automatic mode obtains the tokenizer from the target machine or model repository to generate random input of the target length. In this run, it resolves to ms://Qwen/Qwen3-14B. The chat template may add input tokens, so use the actual ISL / OSL in the report.
- Click Start Evaluation to open the details page. In Target Under Test, check the service name and the
serverload origin.
If a message says that an evaluation is already running on the target, click Cancel and wait for it to finish. If the service returns an error because it does not support ignore_eos, disable fixed output length and run again. Interpret the results using the actual OSL in the report; do not assume that every request generates 128 tokens.
3. Read the Report From Four Perspectives
- Wait for the status to become Completed. Confirm that Point Results contains three rows for concurrency levels
1, 2, 4, with total request counts of10, 20, 40, respectively. - Click Customize Columns and show Concurrency, ISL / OSL, Total Requests, Success Rate, TTFT P50, Interactivity (per-user output speed), and Average Output Throughput.
- Review the four perspectives in the table below for each row, then compare how they change with concurrency.
| Perspective | Metric | Interpretation |
|---|---|---|
| Do requests succeed? | Success Rate | The proportion of successful requests at this point; check errors and details first if any requests fail |
| How long do you wait for the first token? | TTFT P50 | The wait from sending a request to receiving its first token, including queueing and prompt processing; P50 is the median for this set of requests |
| How fast is output once the answer starts? | Interactivity | 1000 ÷ TPOT P50 (ms), in tok/s/user; excludes the wait before the first token |
| How many tokens does the whole service output per second? | Average Output Throughput | Total output tokens from successful requests at this point, divided by the time from the first request sent to the last request completed |
Do not substitute overall throughput divided by concurrency for per-user output speed. Even when overall throughput increases, the wait for an individual request's first token may grow. Read these metrics together.
The following measurements come from the tutorial-performance-random run on 2026-10-20. All three points have a 100% success rate. Record your own service's values as you follow the tutorial.
| Concurrency | Successful / Total Requests | TTFT P50 (ms) | Per-User Output Speed (tok/s/user) | Average Output Throughput (tok/s) |
|---|---|---|---|---|
1 | 10 / 10 | 1561.21 | 31.38 | 20.04 |
2 | 20 / 20 | 1638.67 | 21.51 | 32.80 |
4 | 40 / 40 | 4878.68 | 16.59 | 41.07 |
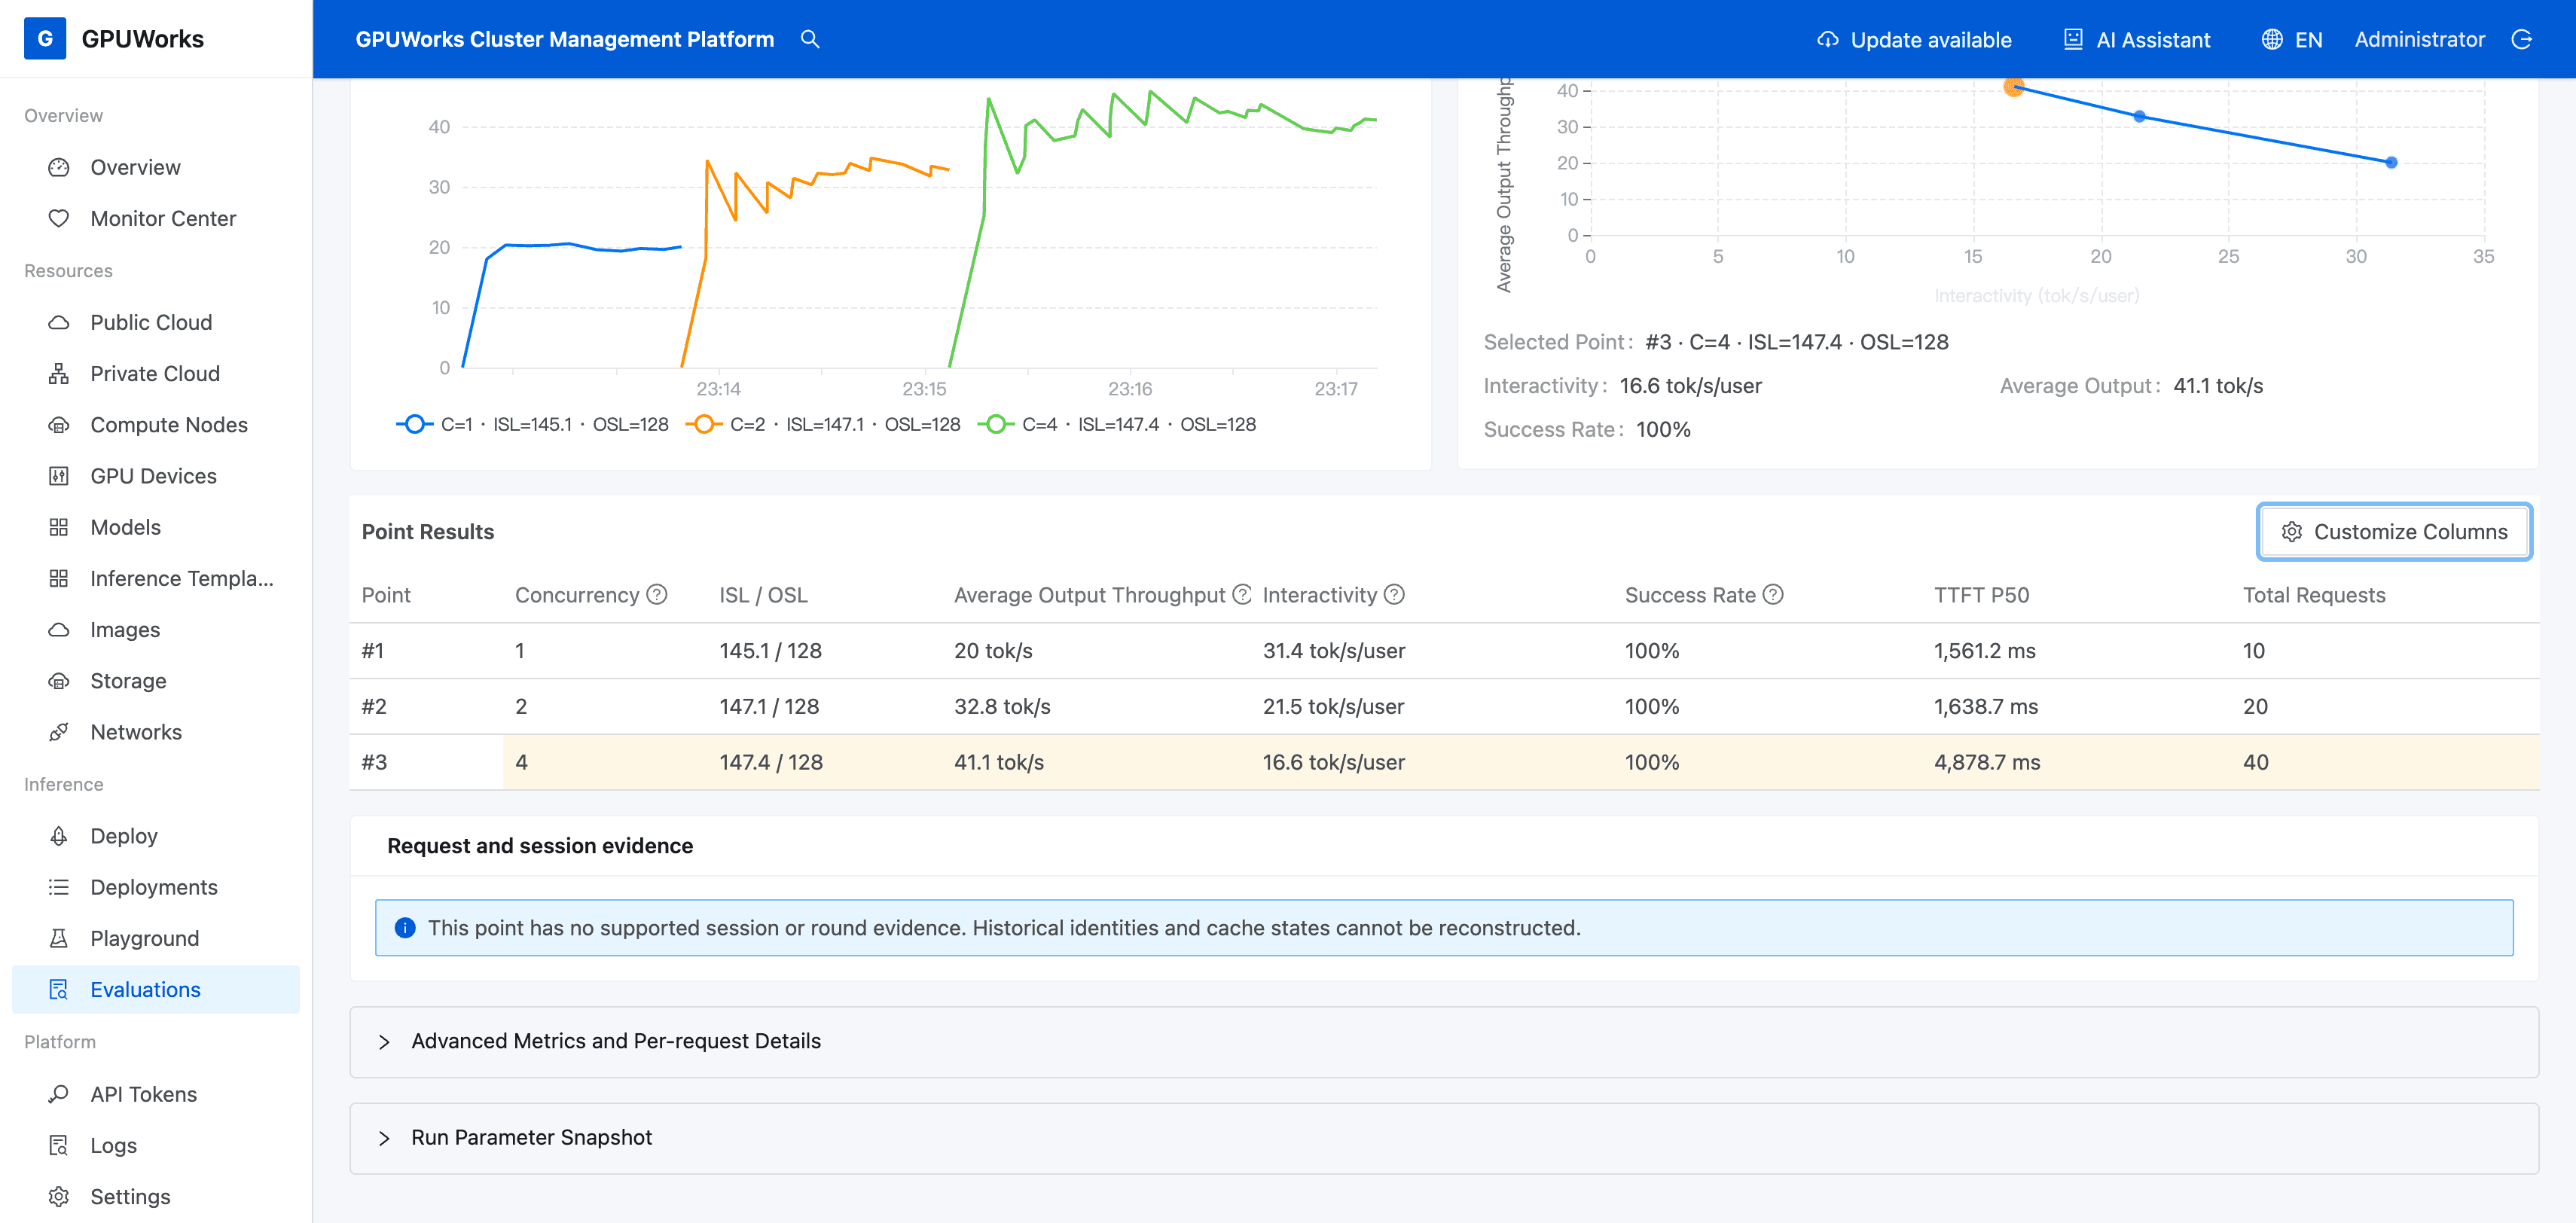
From concurrency 1 to 4, average output throughput increases from 20.04 to 41.07 tok/s, approximately 2.05 times the original value. Meanwhile, per-user output speed drops from 31.38 to 16.59 tok/s/user, and median time to first token rises from 1.56 to 4.88 seconds. More overall output does not mean that every user receives a faster answer.
In this run, the actual average input length across the points is 145.10–147.43 tokens, and the output length is 128 tokens at every point. The target and actual input lengths differ, so record the actual lengths when reading the report.
If the task fails or only some points complete, check the errors and rerun it. If output tokens are present but both throughput and timing are 0, retain the details for investigation; do not interpret this as zero latency. For more metrics, see Run Evaluations and Interpret Reports.
4. Save the Report
- Choose Export Report → Download Standalone HTML (with charts). Open the downloaded file and confirm that you can view all three points. Select Download CSV if you also need tabular data.
- Expand Run Parameter Snapshot and click Copy the complete parameter snapshot. Save it with the report to retain the service, model, image, workload, and concurrency configuration.
- To repeat the test, click Run Again, check the service and parameters, and start. When comparing two runs, record and control the conditions you intend to change.
Completion criteria: All three points finish; you can explain from the report whether requests succeed, how long the first token takes, how fast output is once generation starts, and the throughput of the whole service; and you save a report that you can reopen.
This small random workload teaches you how to run performance evaluations; it does not establish business capacity. To assess business capacity, first define acceptable success rates and response times. Then use representative business samples and input/output lengths, increase the request count, and repeat the tests.
Was this page helpful?