Tutorials
Investigate a Slow Response
On this page
When a model answers successfully but takes a long time to start or finish its response, use request history to see which stage takes the time. In this tutorial, you make a Playground request, find its record, interpret its timing, and use its request ID to find the same record again.
All screenshots in this tutorial show the English UI and the same completed example request. Request IDs and timings are examples; your run may differ.
Before You Begin
- You have permission to open Playground and Monitor Center.
- You have a chat service that streams answers successfully in the Playground, and you can view its request history.
- If the engine provides per-request timing, you can distinguish stages such as queuing and prefill. Otherwise, you can still see the overall wait and output durations.
This tutorial uses a single-node, single-replica service named mac-gpt-oss, running mlx-community/gpt-oss-20b-MXFP4-Q8 with vLLM 0.31.0 on an Apple GPU. Per-request timing is enabled, and the example uses low reasoning effort. Select your own service as you follow along. You do not need to complete other tutorials, and your answer and timings do not need to match the example.
1. Send an Easily Identifiable Request
-
Open Playground → Chat, click New conversation (the plus sign), and select your service. This example uses
mac-gpt-oss. -
Click Parameters to the right of the model selector. Select Maximum Output Tokens and enter
2048. Keep Stream options → Report usage (include_usage) enabled. For this example, click Low Reasoning Effort under Extra Parameters. The output limit does not mean the model necessarily generates that many tokens. -
Enter the following prompt, note the current time, and click Send.
Write an approximately 600-word beginner's guide for colleagues using large language models for the first time. Use six sections: what it is, suitable tasks, how to phrase a question, how to add context, how to verify results, and how to protect sensitive information. Give one concrete example in each section. Do not use a table.
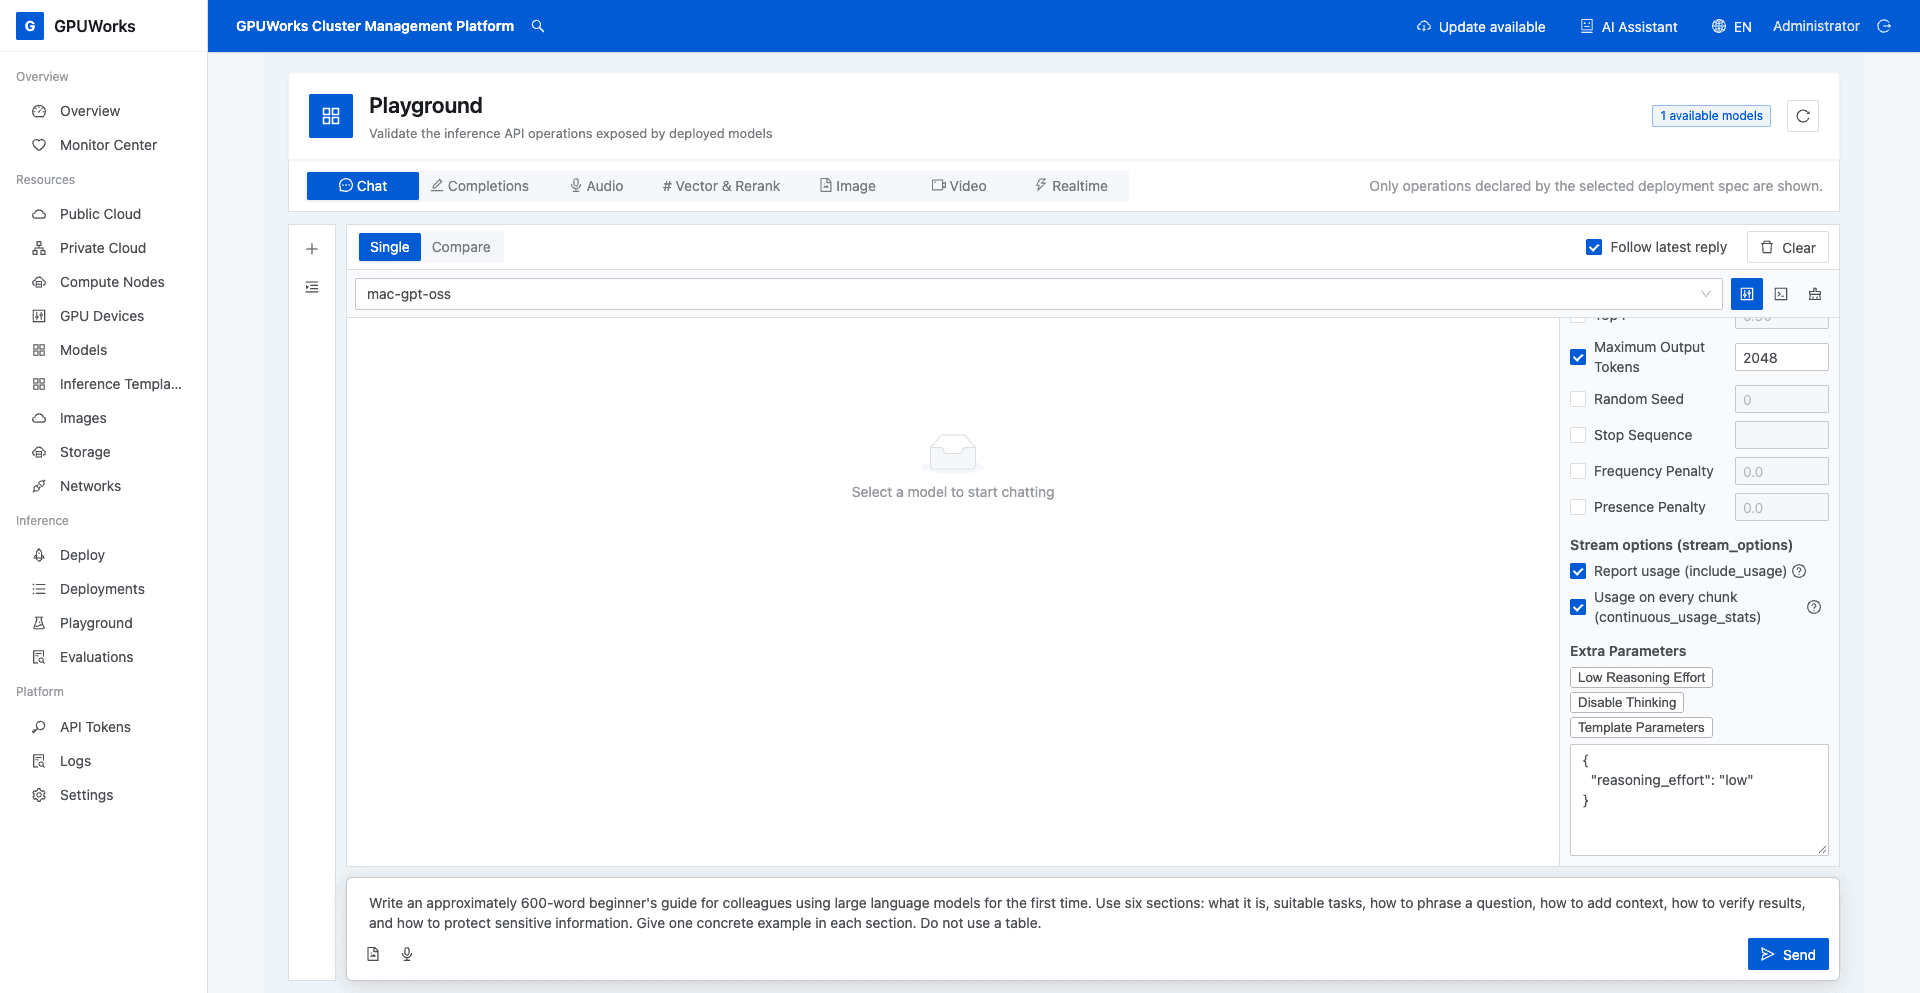
- Wait for the answer to finish and confirm that there is no request error. Notice whether the main delay occurs before the answer starts or while it continues to stream. The example request completes normally; the following steps use its details to determine the time spent in each stage.
If the request fails or you stop it manually, resolve the issue and try again. This tutorial analyzes a request that completes normally.
2. Find the Request in the Service History
- Open Monitor Center and click the service you selected in the service list.
- Select 6h at the top of the page and switch to History.
- Enter a time range covering the request in From and To, pressing Enter to confirm each field. Use the format
MM-DD HH:mm. This example uses10-24 02:30through10-24 02:34. - Select Completed for the result, enter
5seconds in End-to-end ≥, and click Reload. The example request takes about83.3 s, so it meets this filter.
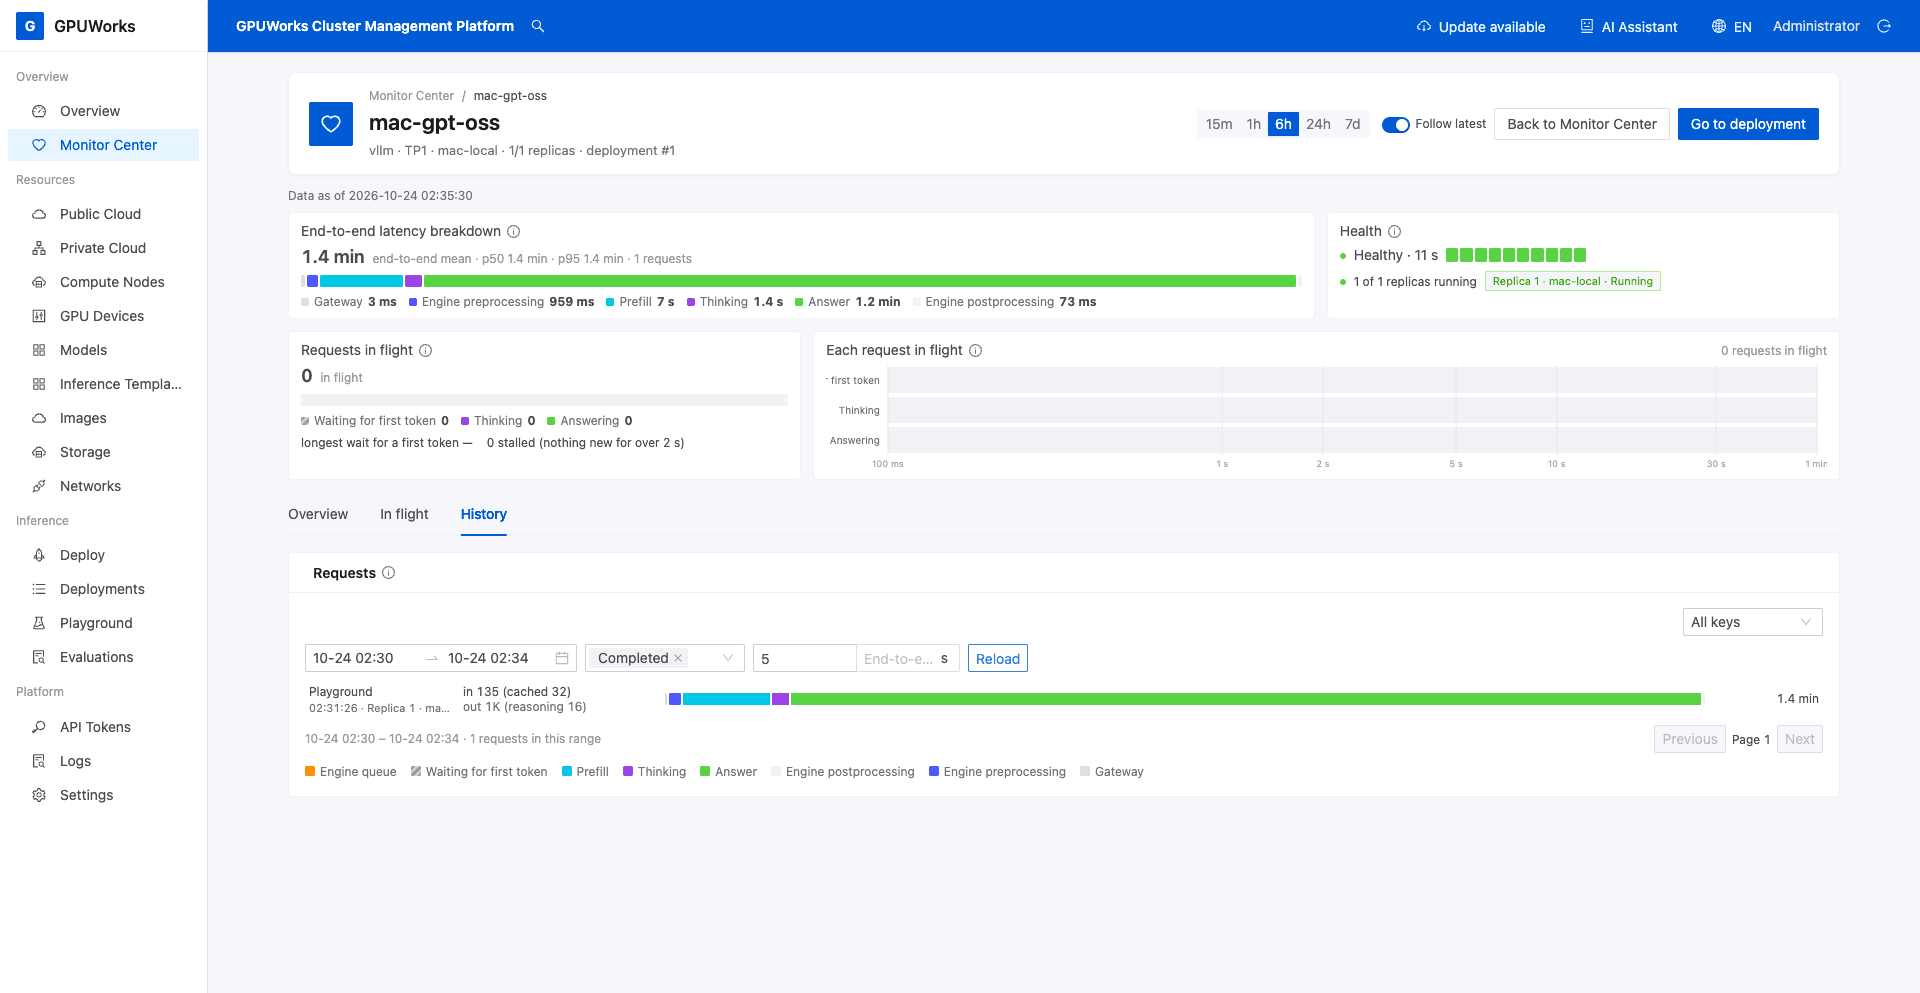
- Find the request by its time and Playground caller, then click its row to open Request details. The example's received time is
10-24 02:31:26.
If there are no results, clear the minimum end-to-end duration and check the time range first. Your request might take less than 5 seconds. Use this individual request's timings for the following analysis; the averages at the top of the page describe all requests in the selected period.
3. Identify Where Most of the Time Goes
- Check the service name at the top of the page, then check Received, Caller, and Replica at the top of the details. Click the copy button beside Request ID and save it. The example ID is
r10441. - At the bottom of the details, confirm Status 200 and finish stop, then check total and the duration of each stage.
- Compare the stages and identify the longest one. The table below uses the exact recorded values for this request; the screenshot rounds longer stages to seconds or minutes.
| Stage | Recorded value in this example | Meaning |
|---|---|---|
| Gateway | 3 ms | Time the gateway spends dispatching the request |
| Engine preprocessing | 959 ms | Time before the first generated token that is not attributed to engine queuing or prompt computation |
| Prefill | 7036 ms | Time the engine spends processing the input prompt |
| Thinking | 1424 ms | Time between the first generated token and the first answer token |
| Answer | 73759 ms | Time from the first answer token to the last text chunk |
| Engine postprocessing | 73 ms | Time after the last text chunk until the request ends |
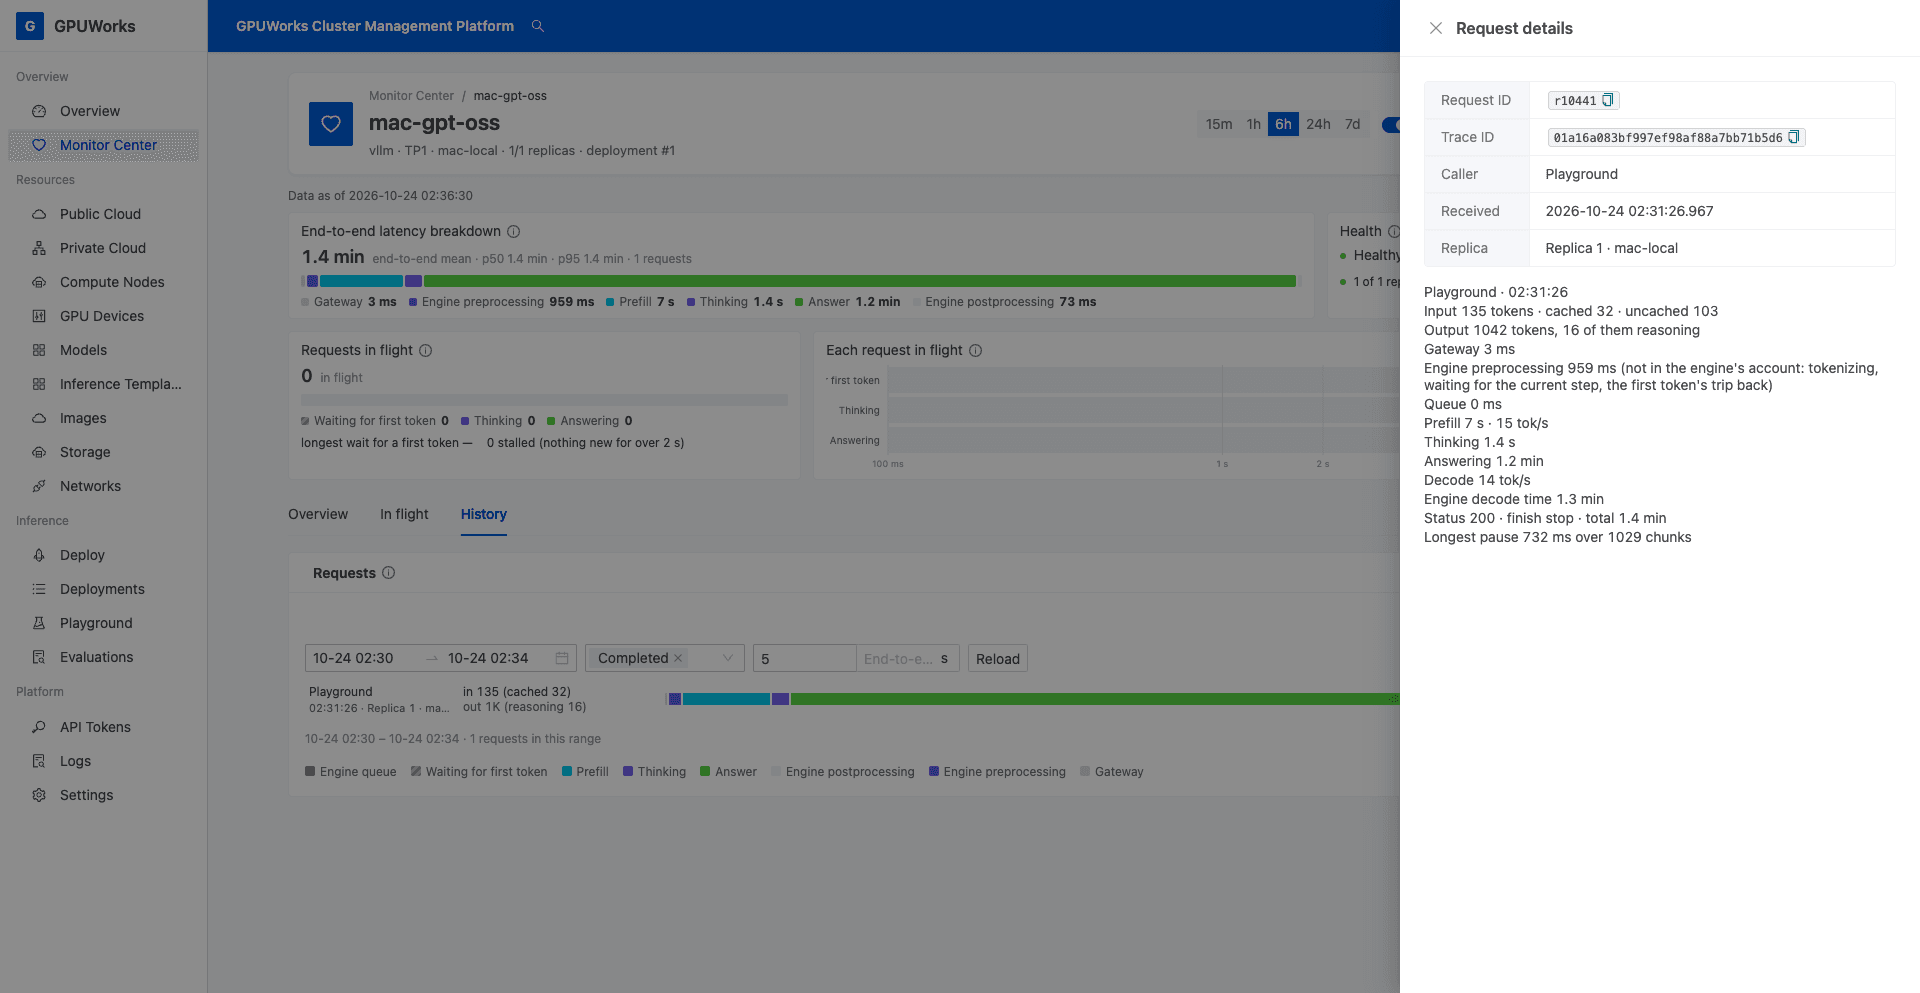
This request has 135 input tokens (32 cached), 1042 output tokens, and 16 thinking tokens. The first generated token arrives 3 + 959 + 7036 = 7998 ms, or about 8.00 s, after the gateway receives the request. Thinking lasts another 1424 ms, so the first answer token arrives after 9422 ms, or about 9.42 s. The full request takes 83254 ms, or about 83.25 s.
Most of this request's time is spent generating the answer: the answer stage takes about 73.76 s, or approximately 88.6% of the total duration. The first answer token arrives at about 9.42 s, so the full 83.25 s cannot be described as waiting for the answer to start. Draw your own conclusion from the longest stage in your request.
In this example, Thinking falls between the first generated token and the first answer token. If your engine does not separate queuing and prefill, the page shows a combined Waiting for first token stage. Interpret the stages actually shown; do not attribute the combined wait directly to the network. Engine decode time in the details is for comparison and must not be added again to the sum of the colored stages. For complete definitions, see Request Timeline and Stage Breakdown.
4. Find the Same Record by Request ID
- Close the details and return to the Monitor Center home page.
- Paste the request ID you saved in section 3 into the Request ID / trace ID search box at the upper right, then press Enter. This example uses
r10441; replace it with your own ID. - Click the matching record in the Request panel on the right. Confirm that its Request ID, Deployment, Received time, and total duration match the record you just examined.
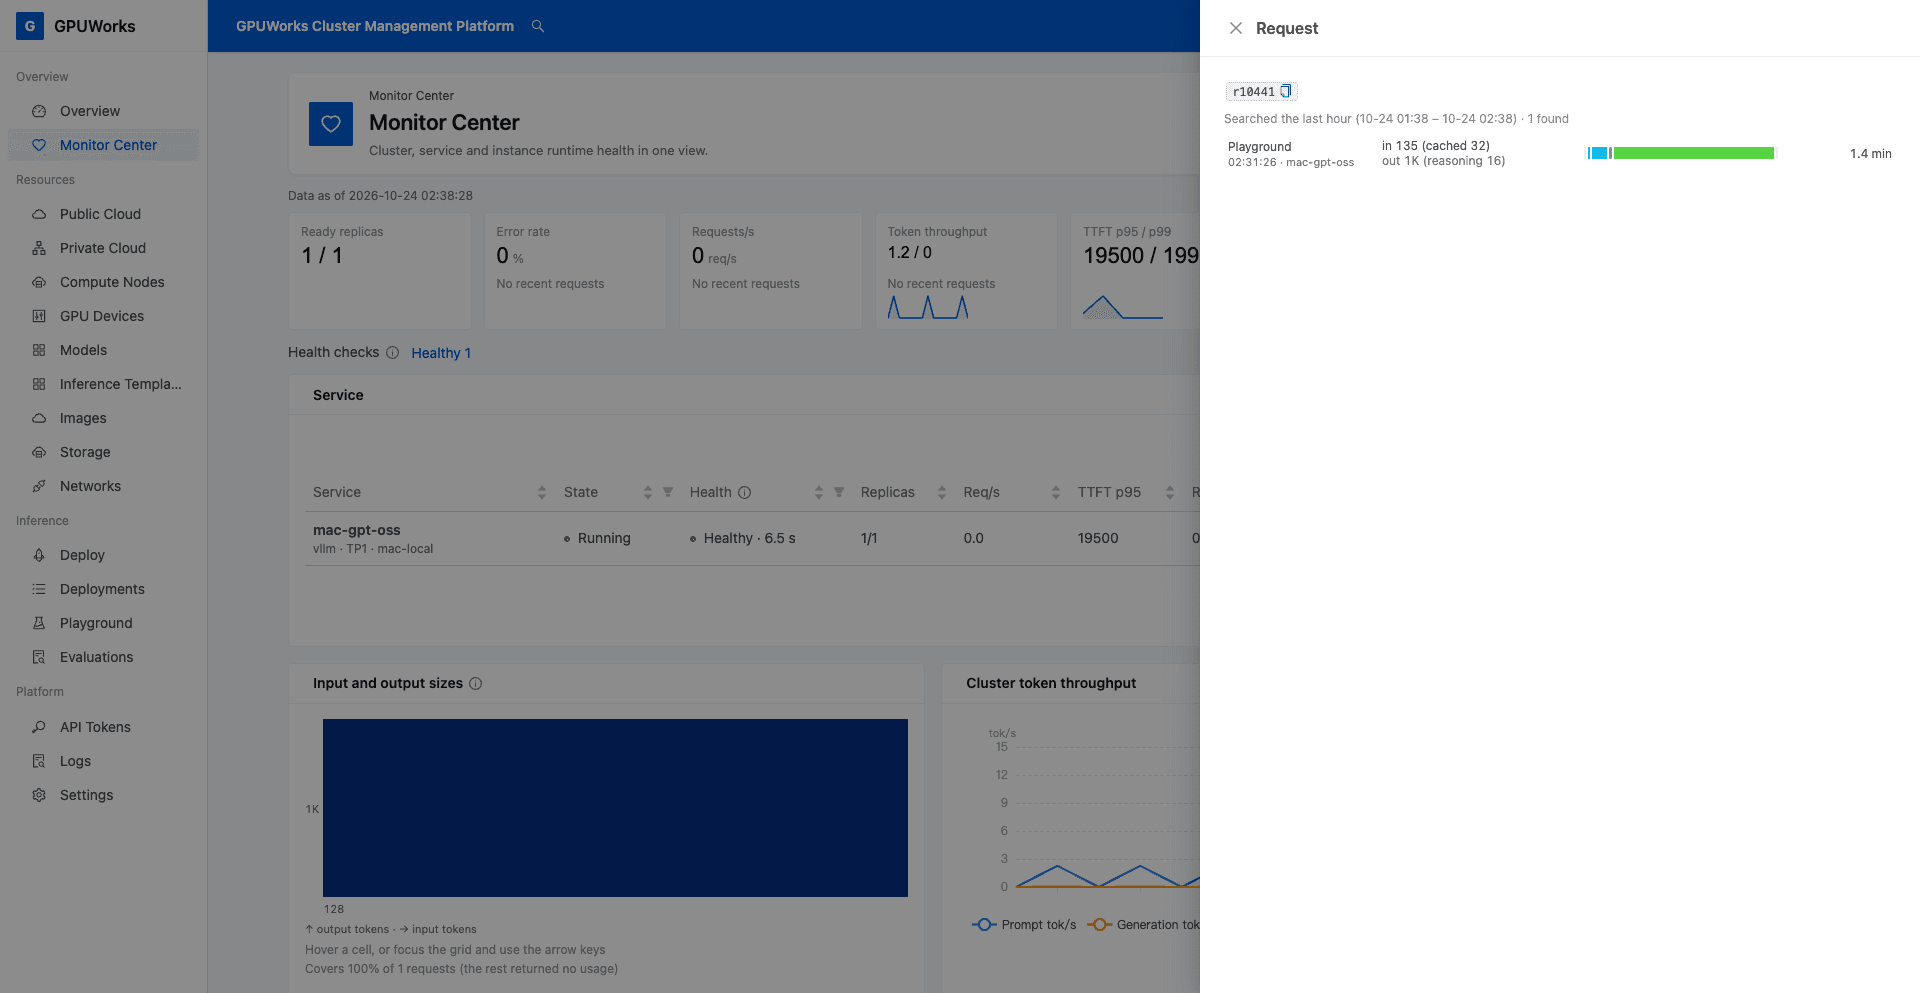
The search covers the last hour by default. If it shows Nothing found, click Widen to the last 24 hours. If the request still does not appear, check the ID, request time, and whether the record was saved. Request history has retention and sampling limits; a missing record does not prove that a request never occurred. See Data Sources and Limitations in the Monitoring Guide.
Completion criteria: You can find your request in the service history and find the same record again by request ID. You can explain the relationship between waiting for the first token, answer generation, and total duration, and identify where most of the time goes based on the actual stages.
Was this page helpful?